Quantcast
Channel: Tech Support
Viewing all 880 articles
Browse latest View live

Deploying vSphere Replication Appliance

$
0
0

This guide will walk you through the steps to deploy vSphere Replication Appliance within your virtualization environment. You can download ovf template of vSphere replication appliance from the following link of VMware download center.


You need to prepare your vCenter Server prior to deploy vSphere Replication Appliance. When you are done then follow the instruction below to begin with the deployment.

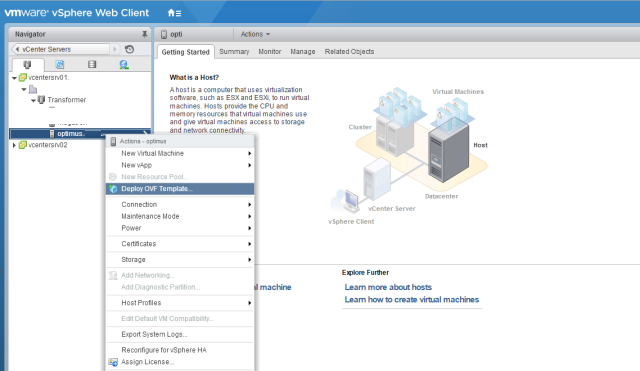
Login to vCenter Web Client and select the ESXi host where you want to deploy the vSphere replication appliance and right click on it and choose Deploy OVF template.


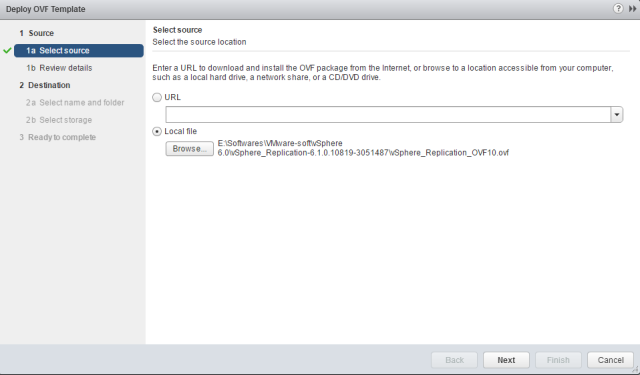
Browse to the directory where you have downloaded the ovf file and click Next.


Do not get confuse on appliance version. The steps will be remain same if you deploying latest version.

Click Next.


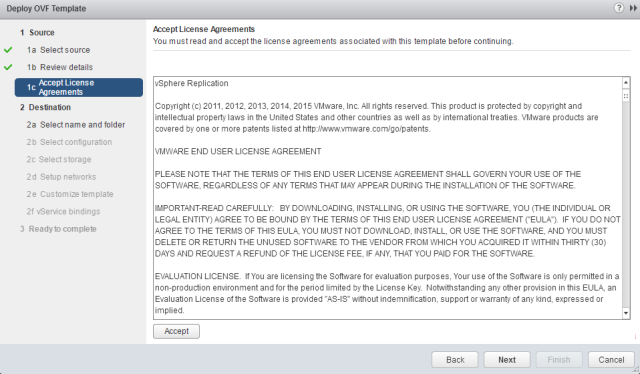
Accept the EULA and click Next to continue.


Provide a name for the replication appliance VM and choose the location where it will be deployed. Click Next to continue when you are done.


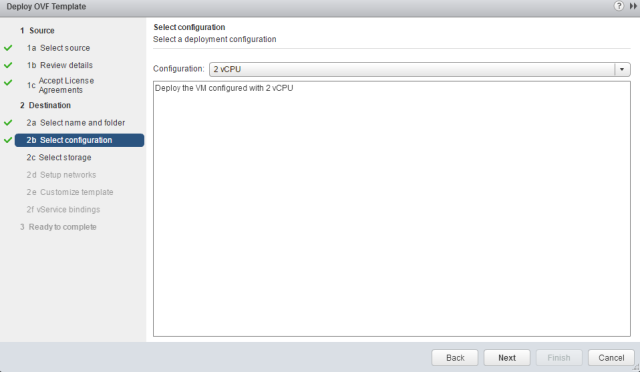
Now Select Configuration page, select the number of vCPU that you need to allocate to the replication appliance. By default it is deployed with 4 vCPU, but  you can go with 2 vCPU if your environment is small. Click Next to continue.


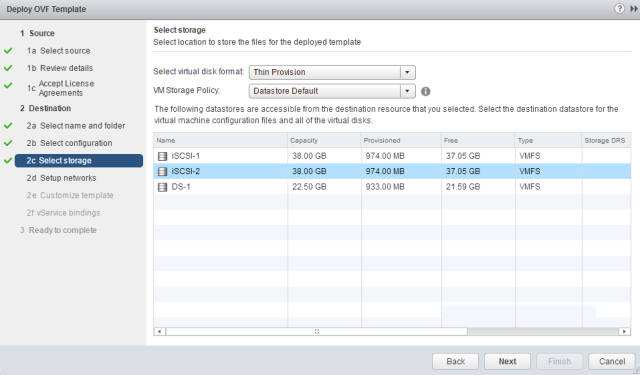
Select the datastore where the appliance will be deployed and select the provisioning type from select virtual disk format drop down menu. It can be either thick or thin. Click Next to continue.


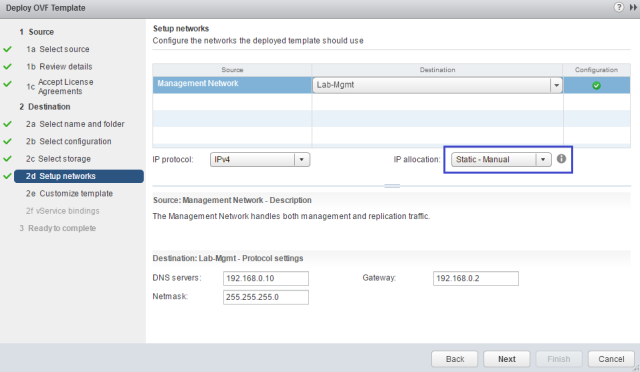
Select the portgroup for the Management Network of the replication appliance. Select Static-Manual from IP allocation if you don't have a DHCP server in your environment. Provide the DNS/Netmask and Gateway details.

Click Next to continue.


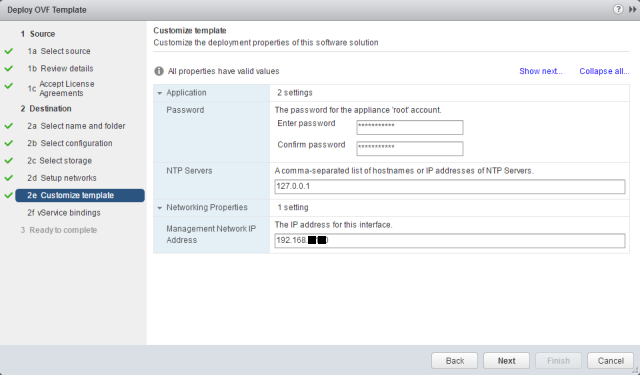
Provide the root password of the appliance and the IP address that will be used to manage the appliance. Click Next.


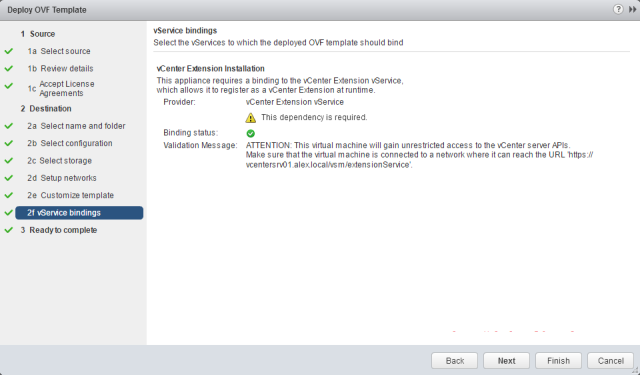
Under the vService bindings, don't proceed until you see binding status as green.


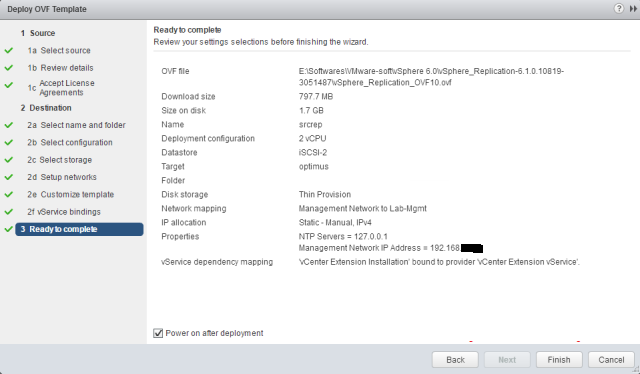
On Ready to complete page, review your settings and finish to start the deployment.


Wait for deployment to finish. You can monitor the progress under recent tasks.


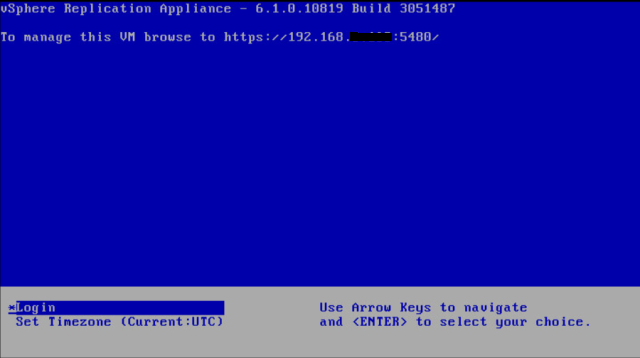
Once the deployment is finished and replication appliance vm is loaded, you will see following screen which displays the URL for managing the appliance.


Now you are ready to perform configuration steps. This step by step guide will help you to perform configuration tasks on your vSphere Replication Appliance according to your environment.

Preparing vCenter Server for vSphere Replication 6

$
0
0

This guide will take you through the steps to configure vCenter prior to deploying and configuring vSphere Replication 6 within your virtualization environment. 


STEP1 - vCenter Server Managed IP Address

The managed address settings corresponds to vCenter server name, so basically its the IP address of the management network. By default this managed address field is left blank. The vSphere Replication appliance require this to exist, so you need to set up the management IP address of your vCenter server here and then reboot vCenter server.

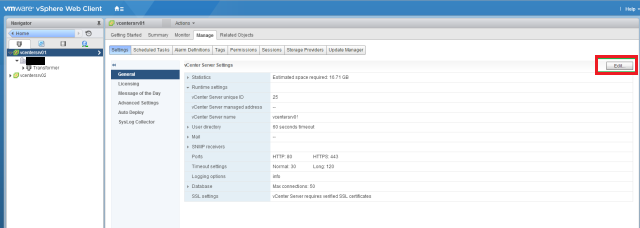
To set up the managed address settings, Login to vCenter Server Web Client and Navigate to home and select vCenter Server > Manage > Settings and click on Edit button.


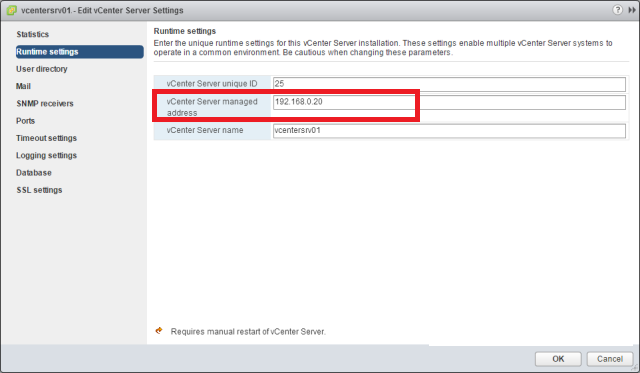
Select Runtime Settings and click in the IP address box of the vCenter Server then click OK. You need to reboot vCenter for changes to take effect.


STEP2 - Creating and Configuring Replication Portgroups

This is important to create D portgroup and vmkernel adapters for replication traffic. Follow the steps mentioned below.

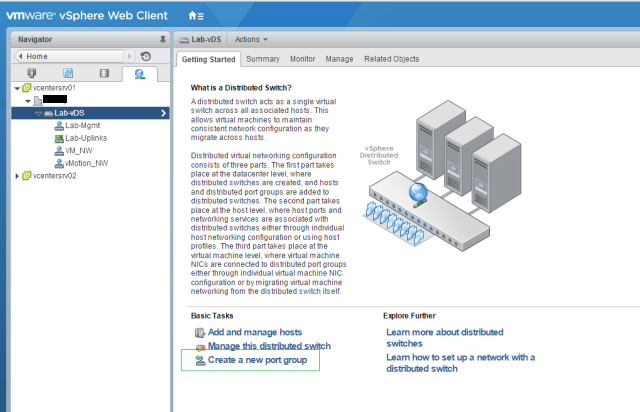
Go to Networking view from vCenter Web Client and select your dvSwitch.  Select Getting started tab and click on Create a new port group


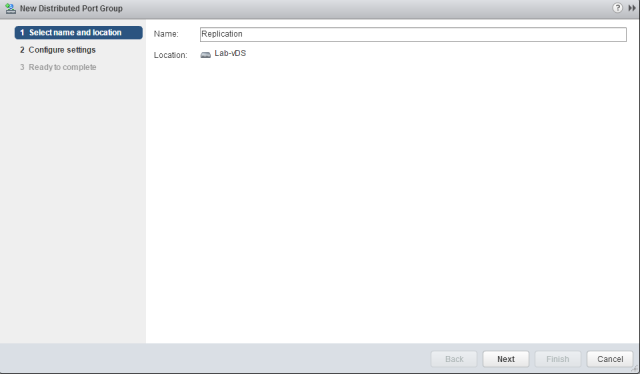
Provide a name for the D port group and click next.


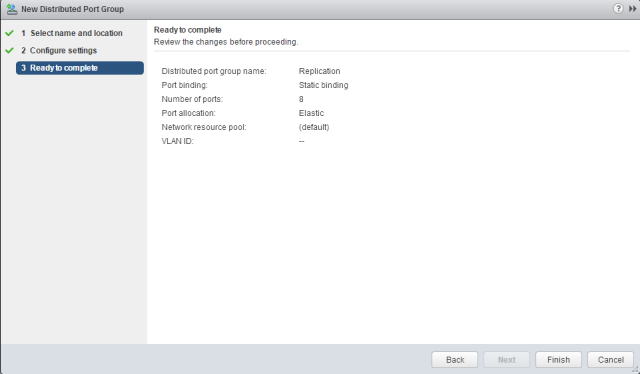
Leave the settings to default and click next.


On Ready to complete page Click Finish.


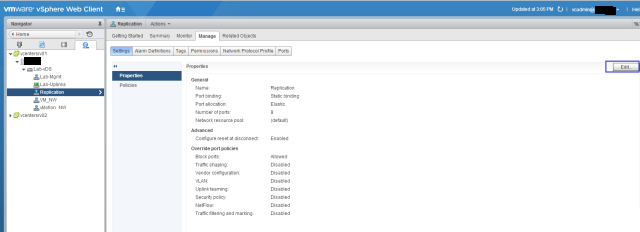
Select the newly created port group and click on Edit button.


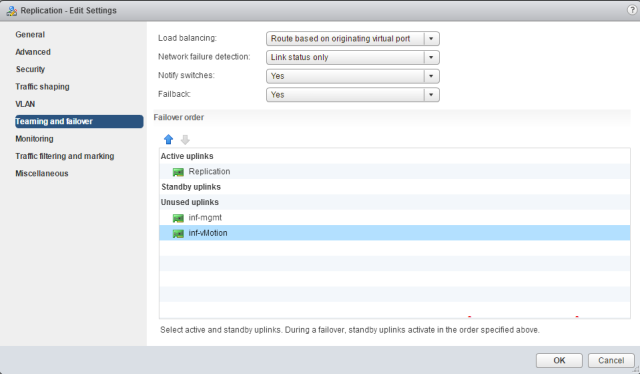
Go to Teaming and failover settings and choose the correct uplink interface for the D port group and click OK.


Now Create VMkernel Portgroup for replication and attach physical adapter to it.

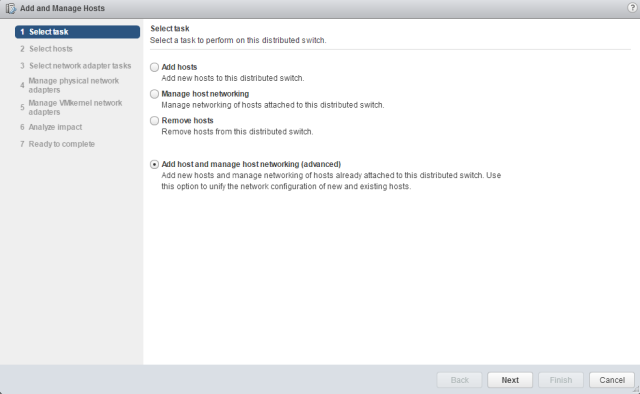
Select the dvSwitch and click on Add and manage hosts.


Select Add host and manage host networking (advanced) and Click Next.


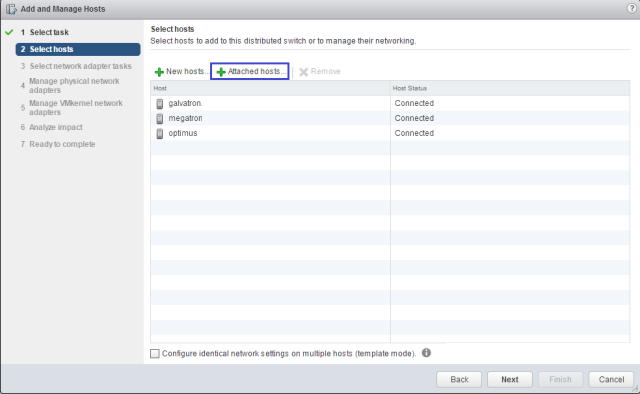
Click on Attached hosts and select your ESXi hosts. When done, Click Next to continue.


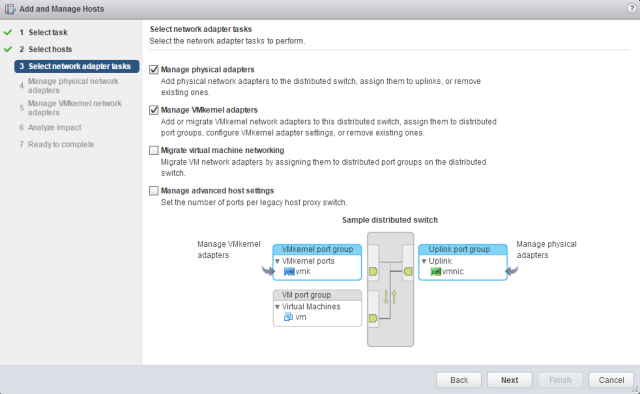
Select Manage physical adapter and manage VMkernel adapter checkbox and Click Next.


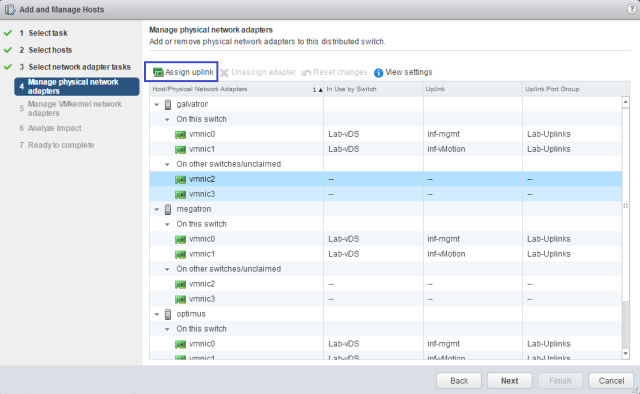
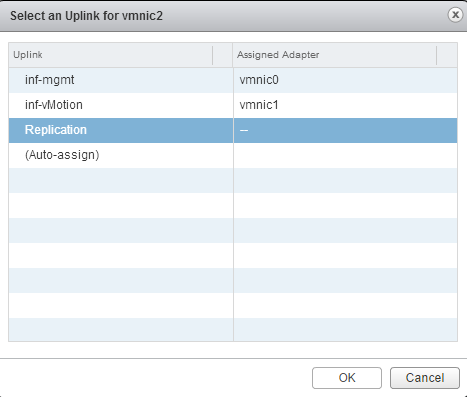
Click on Assign uplink and select the correct uplink that will be served for replication traffic. We have already created a new uplink named Replication in my testlab setup.


Select the uplink and Click OK.


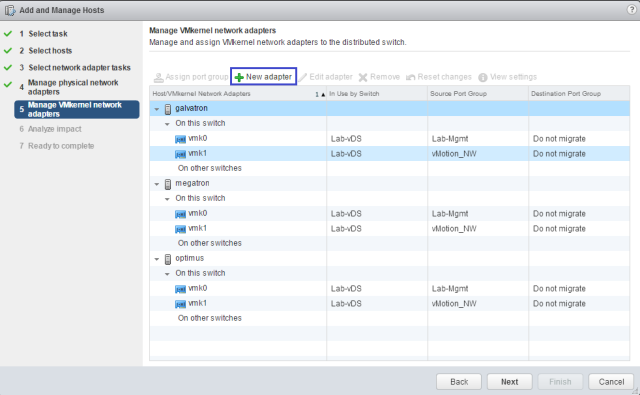
Click on New adapter to add the VMkernel portgroup for replication and click Next.


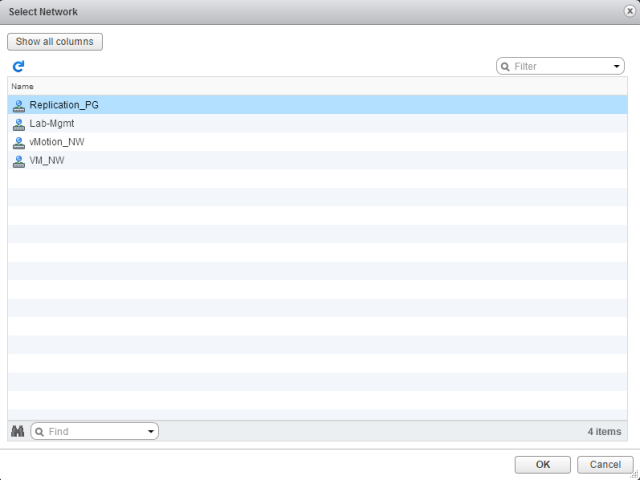
Click on browse button to select the portgroup. We have already created a portgroup in above step for this. We will select that portgroup here.


Select the port group created for replication traffic and click OK.


Click Next to continue.


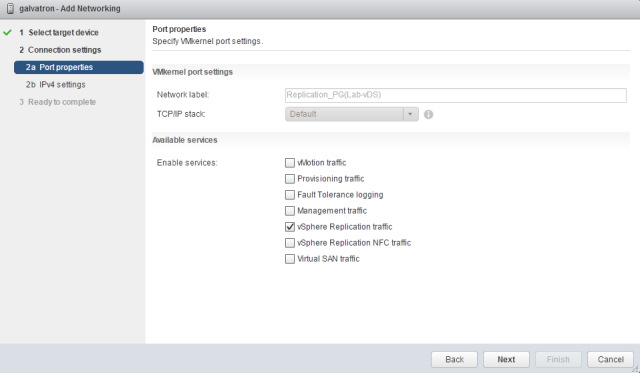
Under Port properties option select only vSphere Replication traffic (if this is the vCenter Server at your source site). For destination site's vCenter, we have to select vSphere Replication NFC traffic. Click Next to continue.


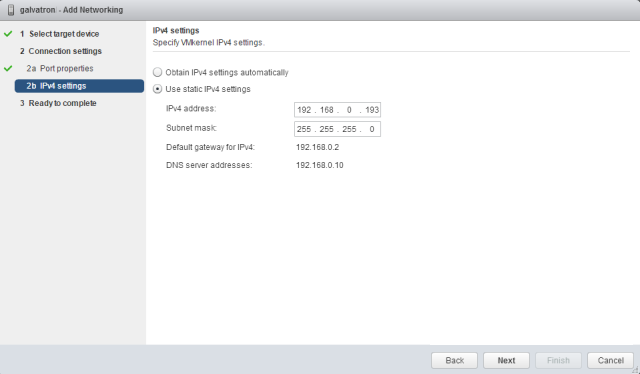
Provide IP address for the replication VMkernel port group and click Next.


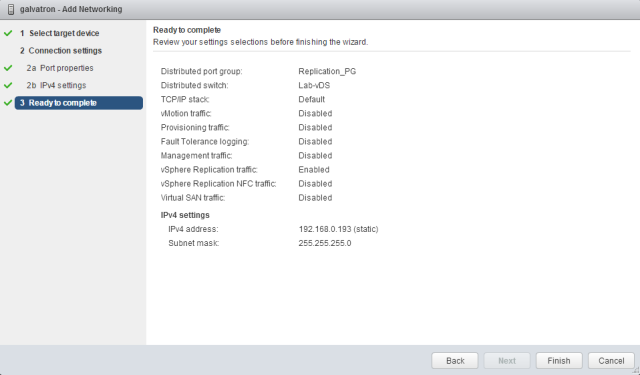
On ready to complete page click Finish.


Click Next on Analyse impact option if all shows green.


Click Finish to complete the configuration.


Now you are ready to to deploy vSphere replication appliance. This step by step guide will help you to deploy and configure vSphere Replication 6.

Import and Export Databases in MySQL or MariaDB

$
0
0

For database administrators, import and export database is an important skill to have. Data dumps can be used for backup and restoration purposes, so you can recover older copies of database in case of an emergency disaster like situation, or you can use them to migrate data to a new server or development environment.


This guide will show you how to export the database as well as import it from a dump file in MySQL and MariaDB.

Prerequisites

To begin with import and/or export a MySQL or MariaDB database, you will need access to the Linux server running MySQL or MariaDB and you should have the database name and user credentials to perform the steps mentioned in this article.

Exporting the Database

The mysqldump console utility is commonly used to export databases to SQL text files. These files can easily be transferred and moved from server to server. You will need the database name itself as well as the username and password to an account with privileges allowing at least full read only access to the database.

Export your database using the following command.

mysqldump -u username -p database_name> data-dump.sql

  • username is the username you can log in to the database with
  • database_name is the name of the database that will be exported
  • data-dump.sql is the file in the current directory that the output will be saved to


The command will produce no visual output, but you can inspect the contents of filename.sql to check if it's a legitimate SQL dump file by using:

head -n 5 data-dump.sql

The top of the file should look similar to this, mentioning that it's a MySQL dump for a database named database_name.

SQL dump fragment

-- MySQL dump 10.13  Distrib 5.7.16, for Linux (x86_64)
--
-- Host: localhost    Database: database_name
-- ------------------------------------------------------
-- Server version       5.7.16-0ubuntu0.16.04.1

If any errors happen during the export process, mysqldump will print them clearly to the screen instead.

Importing the Database

To import an existing dump file into MySQL or MariaDB, you will have to create the new database. This is where the contents of the dump file will be imported.

First, log in to the database as root or another user with sufficient privileges to create new databases.

mysql -u root -p

This will bring you into the MySQL shell prompt. Next, create a new database called new_database.

mysql> CREATE DATABASE new_database;

You'll see this output confirming it was created.

Output

Query OK, 1 row affected (0.00 sec)

Now exit the MySQL shell by pressing CTRL+D. On the normal command line, you can import the dump file with the following command:

mysql -u username -p new_database < data-dump.sql

  • username is the username you can log in to the database with
  • newdatabase is the name of the freshly created database
  • data-dump.sql is the data dump file to be imported, located in the current directory


The successfully-run command will produce no output. If any errors occur during the process, mysql will print them to the terminal instead. You can check that the database was imported by logging in to the MySQL shell again and inspecting the data. This can be done by selecting the new database with USE new_database and then using SHOW TABLES; or a similar command to look at some of the data.


Conclusion

We have demonstrated the steps of how to create database dumps from MySQL databases as well as how to import them again.

How To Transfer Installed Applications From One Computer To Another

$
0
0

This article will guide you through the steps to take backup of your installed applications settings on Windows, transfer them to a new computer and you don't need to re-configuring them.


CloneApp is a free program, that allows you to easily backup configuration files in program directories and the Registry for many popular Windows applications. It supports a large number of applications, including many versions of Microsoft Office, Microsoft Edge, Photoshop, DisplayFusion, Evernote, foobar2000, LibreOffice, MusicBee, PotPlayer, TeamViewer, and many more.

We will show you how to use CloneApp to backup and restore a program’s settings from one computer to another, using Microsoft Office application as an example. Make sure any programs you want to backup are closed before you start.

Back Up Settings for CloneApp Supported Programs

To begin with back up settings in programs folders and the registry, download the portable version of CloneApp and extract the .zip file into a folder. To completely back up program settings, CloneApp must be run as an administrator. To accomplish that, right-click on the CloneApp.exe file and select “Run as administrator” from the popup menu. Grant CloneApp permission to make changes to your PC when prompted.


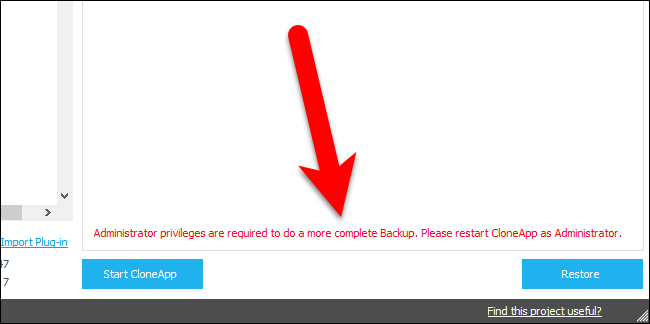
If you run CloneApp without administrator permission, a message displays at the bottom of the CloneApp window warning you that administrator privileges are required to do a more complete backup.


Before we begin backing up programs, we need to make sure the location and structure for the backup are set accordingly, so click “Options” on the left side of the CloneApp window.


The first path is where the program backups will be saved. By default, CloneApp backs up program and registry settings to a folder called Backup in the same directory as the CloneApp program. We recommend you keep the default path. That way, the program backups and the CloneApp program are in the same place and easy to transfer to another to an external hard drive or network drive.

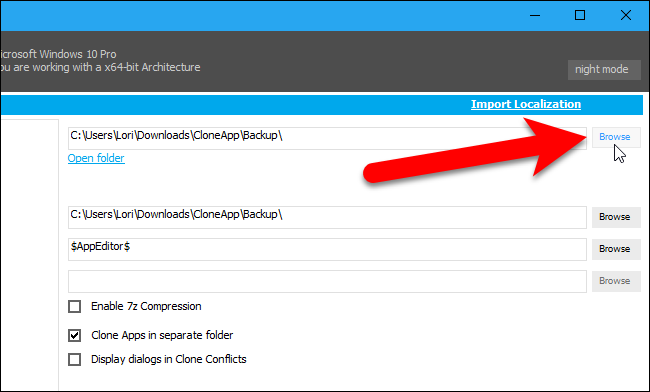
If you want to change the location of the program backups, click the “Browse” button to the right of the first path edit box and select a new path.

The second path is where the log file listing the actions taken during the backup will be saved. We chose to save the log file in the same place as the backed up program settings.

By default, CloneApp puts the backup files for each program in separate folders. You can choose to have all the backup files in the same folder. CloneApp still puts the backed up files in folders labeled with the program names, but the “Clone Apps in separate folder” option separates all the files for each program.

You can also compress the backed up file using 7z compression by checking the “Enable 7z Compression” box. 7-Zip is used to compress the backed up files.

CloneApp displays a confirmation dialog box by default if normal Windows file conflicts are encountered during the backup process. If you check the “Display dialogs in Clone Conflicts” box, the option changes to “Respond silent to all Clone conflicts” and CloneApp will automatically respond to Windows conflict notifications with “Yes”. Existing files and folders will be automatically overwritten, folders will be created if they do not exist, and running applications and processes will be ignored (some files may not be backed up in this case).


To back up program settings folders and registry entries, click “Clone” on the left side of the CloneApp window.


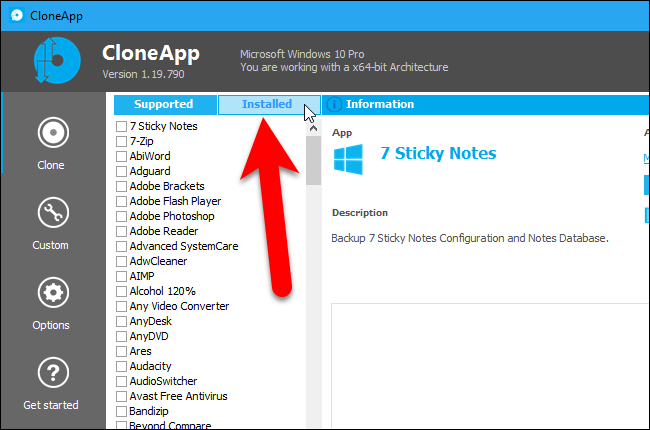
All the supported programs are listed on the left. To see a list of programs installed on your PC that can be backed up, click “Installed”.


This list is just for reference. To select programs you want to back up, click “Supported”.


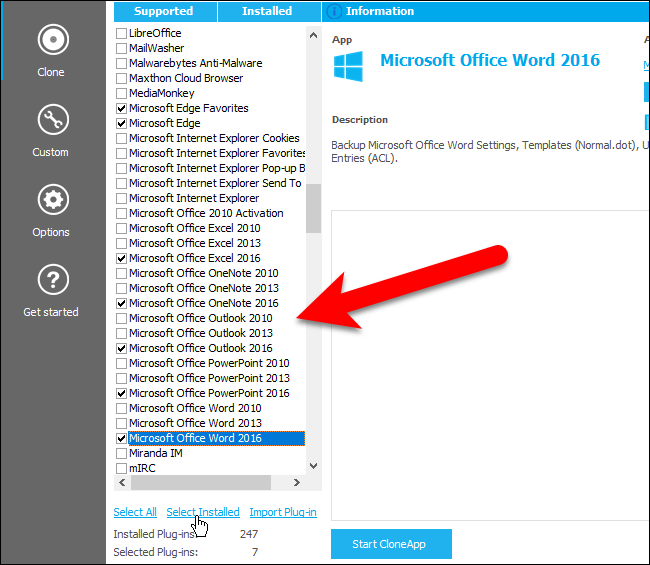
Check the boxes next to the programs you want to back up. To back up all your installed programs that CloneApp supports, click the “Select Installed” link below the list.


To see a preview of the folders and registry entries that will be backed up for the selected programs, click “What is being backed up?”.


The details of what will be backed up are listed, but the files are not actually backed up yet. To back up the selected programs, click “Start CloneApp”.


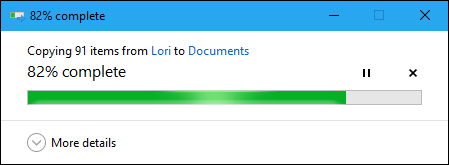
A dialog box showing the progress of the backup displays.


When the backup process is finished, a message displays at the bottom of the log and to the right of the Start CloneApp button.


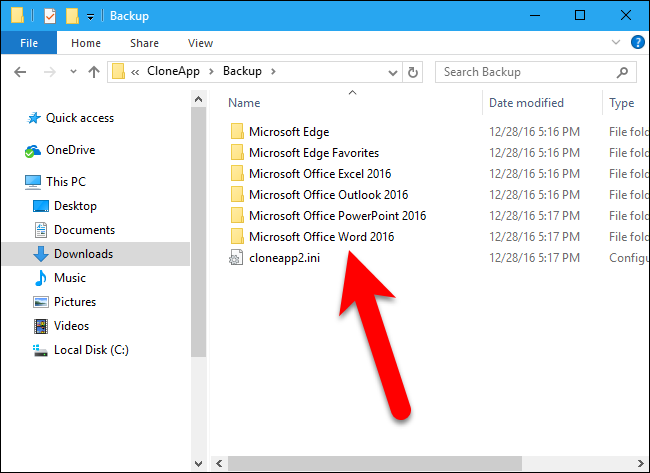
Because we selected the “Clone Apps in separate folder” option, the backup files for each program are put in separate folders.

If you are migrating to a new machine, it would be a good idea to save the entire CloneApp directory to a flash drive, cloud storage folder, or somewhere else easily accessible from the new computer. That way, you’ll have the program and the backup files, and the path to the backup files remain consistent for when you want to restore them.


If we had turned off the Clone Apps in separate folder option, our Backup directory would look like this instead:


Back Up Custom Files and Folders

If you have settings files from a program not supported by CloneApp, or you have some portable programs you want included in the backup, you can back up custom files and folders. To do this, click “Custom” on the right side of the CloneApp window.

Custom files and folders are backed up separately from the built-in CloneApp program backups.


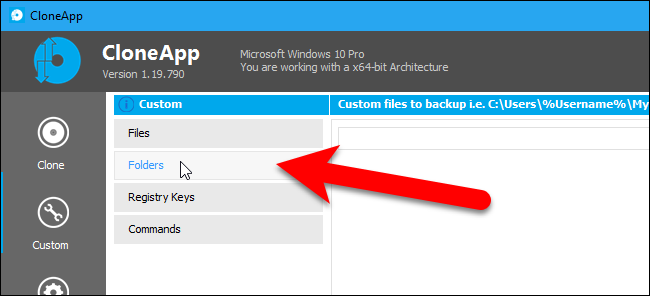
Under Custom on the left, you can choose to back up files, folders, or Registry Keys. You can also add commands to backup settings for a program. The commands feature is useful if you want to run a command to export settings from a program to the Backup directory.

NOTE: When we tested the Registry Keys option, we could not get it to work.

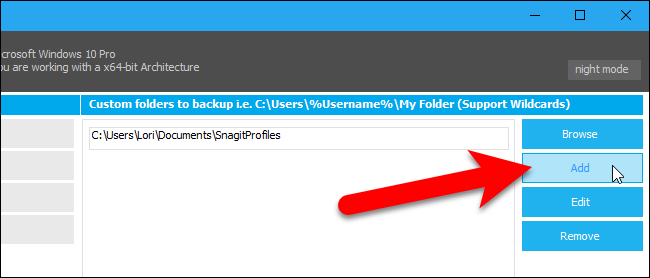
We’re going to back up profiles from Snagit and a portable version of SumatraPDF. To back up folders, click the “Folders” button under Custom.


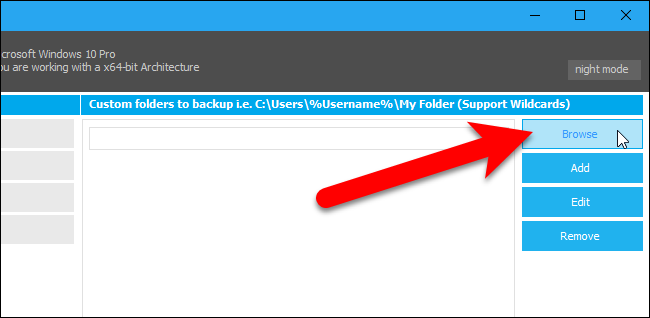
Click “Browse” on the right.


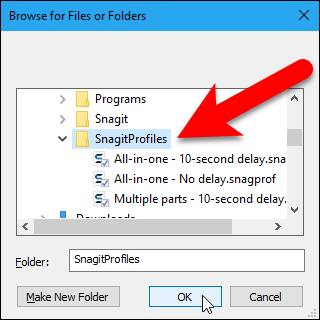
On the Browse for Files and Folders dialog box, navigate to the folder you want to back up, select it, and click “OK”.


To add the selected folder, click “Add”.


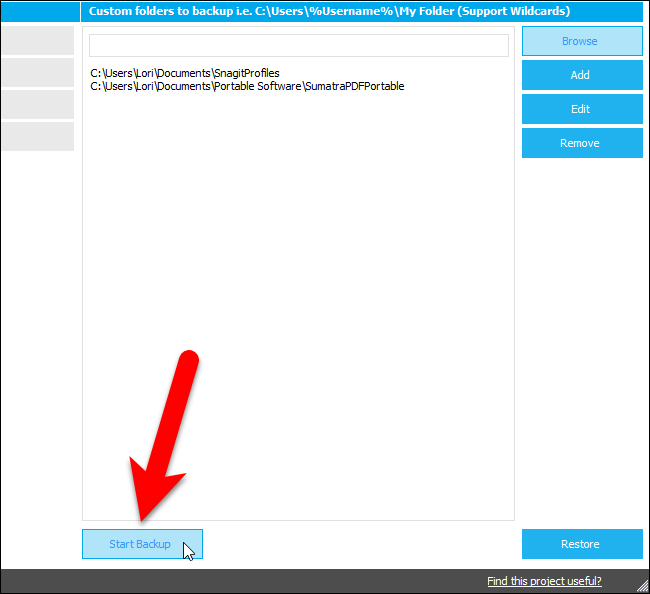
Add any other folders you want to back up in the same manner and then click “Start Backup”.


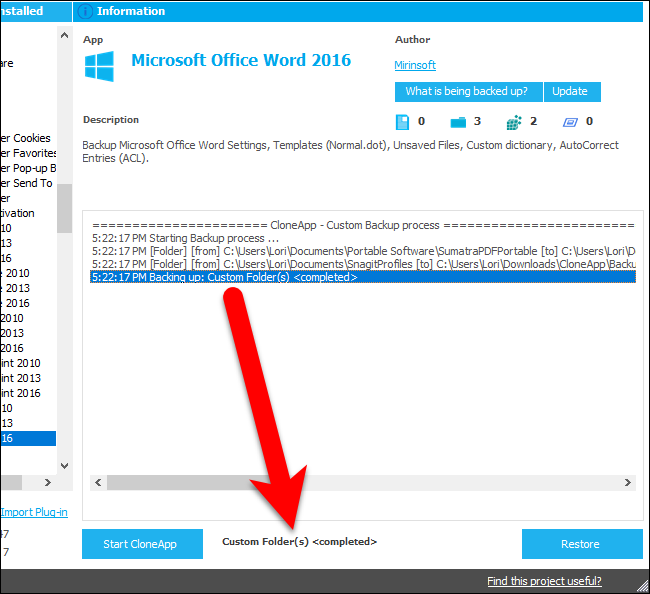
A progress dialog box displays while the folders are being backed up, and then a message displays in the log and at the bottom of the CloneApp window when the process is finished.


The backed up folders (and files, if you selected any individual files) are copied to a Custom folder within the specified backup directory.


Restore Program and Registry Settings on Your New Computer


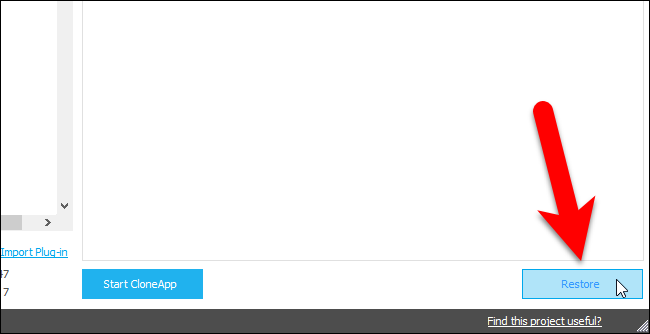
To restore backed up program settings, run CloneApp in administrator mode on the new computer, and click “Restore” in the lower-right corner of the CloneApp window.

NOTE: Cusom files are currently NOT included in the restoration process, so you need to manually copy the backed up custom files from the backup folder to where you want them restored.


As long as there are backed up files and folders in the specified backup folder, the restoration process automatically begins.


When the restoration process is complete, a message displays at the end of the log and at the bottom of the CloneApp window.


That's all for now.

How To Generate a Self-Signed SSL Certificate for Nginx on CentOS 7

$
0
0

This article will guide you through the steps to create a self-signed SSL certificate in order to use with an Nginx web server on a CentOS 7 server to secure web traffic. To begin with self-signed certificate creation process, you need to log into your CentOS 7 Server as a sudo (non-root) user.


Install Nginx and Adjust the Firewall
You should make sure that the Nginx web server is installed on your CentOS 7 machine.

Since Nginx is not available in CentOS's default repositories, it is present in the EPEL (extra packages for Enterprise Linux) repository. You can enable the EPEL repository to access to the Nginx package by executing the following commands:

sudo yum install epel-release

Next, we can install Nginx by typing:

sudo yum install nginx

Start the Nginx service by typing:

sudo systemctl start nginx

Check that the service is up and running by typing:

systemctl status nginx

Output
● nginx.service - The nginx HTTP and reverse proxy server
   Loaded: loaded (/usr/lib/systemd/system/nginx.service; disabled; vendor preset: disabled)
   Active: active (running) since Thur 2017-01-05 16:20:40 UTC; 12s ago

. . .

Jan 05 16:20:40 centos-7-server systemd[1]: Started The nginx HTTP and reverse proxy server.

You will also want to enable Nginx, so it starts when your server boots:

sudo systemctl enable nginx

Output
Created symlink from /etc/systemd/system/multi-user.target.wants/nginx.service to /usr/lib/systemd/system/nginx.service.

Next, we need to make sure that we are not blocking access to port 80 and 443 with a firewall. If you are not using a firewall, you can skip ahead to the next section.

If you have a firewalld firewall running, you can open these ports by typing:

sudo firewall-cmd --add-service=http
sudo firewall-cmd --add-service=https
sudo firewall-cmd --runtime-to-permanent

If have an iptables firewall running, the commands you need to run are highly dependent on your current rule set. For a basic rule set, you can add HTTP and HTTPS access by typing:

sudo iptables -I INPUT -p tcp -m tcp --dport 80 -j ACCEPT
sudo iptables -I INPUT -p tcp -m tcp --dport 443 -j ACCEPT

You should now be able to access the default Nginx page through a web browser.

Create the SSL Certificate
The /etc/ssl/certs directory, which can be used to hold the public certificate, should already exist on the server. Let's create an /etc/ssl/private directory as well, to hold the private key file. Since the secrecy of this key is essential for security, we will lock down the permissions to prevent unauthorized access:

sudo mkdir /etc/ssl/private
sudo chmod 700 /etc/ssl/private

Now, we can create a self-signed key and certificate pair with OpenSSL in a single command by typing:

sudo openssl req -x509 -nodes -days 365 -newkey rsa:2048 -keyout /etc/ssl/private/nginx-selfsigned.key -out /etc/ssl/certs/nginx-selfsigned.crt

You will be asked a series of questions.

Fill out the prompts appropriately. The most important line is the one that requests the Common Name (e.g. server FQDN or YOUR name). You need to enter the domain name associated with your server or your server's public IP address.

The entirety of the prompts will look something like this:

Output
Country Name (2 letter code) [AU]:PK
State or Province Name (full name) [Some-State]:Islamabad
Locality Name (eg, city) []:Islamabad City
Organization Name (eg, company) [Internet Widgits Pty Ltd]:TECH SUPPORT PK
Organizational Unit Name (eg, section) []:IT
Common Name (e.g. server FQDN or YOUR name) []:your_server_IP_address
Email Address []:admin@example.com

Both of the files you created will be placed in the appropriate subdirectories of the /etc/ssl directory.

While we are using OpenSSL, we should also create a strong Diffie-Hellman group, which is used in negotiating Perfect Forward Secrecy with clients.

We can do this by typing:

sudo openssl dhparam -out /etc/ssl/certs/dhparam.pem 2048

This may take a few minutes, but when it's done you will have a strong DH group at /etc/ssl/certs/dhparam.pem that we can use in our configuration.


Configure Nginx to Use SSL
The default Nginx configuration in CentOS is fairly unstructured, with the default HTTP server block living within the main configuration file. Nginx will check for files ending in .conf in the /etc/nginx/conf.d directory for additional configuration.

We will create a new file in this directory to configure a server block that serves content using the certificate files we generated. We can then optionally configure the default server block to redirect HTTP requests to HTTPS.

Create the TLS/SSL Server Block

Create and open a file called ssl.conf in the /etc/nginx/conf.d directory:

sudo vi /etc/nginx/conf.d/ssl.conf

Inside, begin by opening a server block. By default, TLS/SSL connections use port 443, so that should be our listen port. The server_name should be set to the server's domain name or IP address that you used as the Common Name when generating your certificate. Next, use the ssl_certificate, ssl_certificate_key, and ssl_dhparam directives to set the location of the SSL files we generated:

/etc/nginx/conf.d/ssl.conf
server {
    listen 443 http2 ssl;
    listen [::]:443 http2 ssl;

    server_name server_IP_address;

    ssl_certificate /etc/ssl/certs/nginx-selfsigned.crt;
    ssl_certificate_key /etc/ssl/private/nginx-selfsigned.key;
    ssl_dhparam /etc/ssl/certs/dhparam.pem;
}

Now, we will add some additional SSL options that will increase our site's security.

/etc/nginx/conf.d/ssl.conf
server {
    listen 443 http2 ssl;
    listen [::]:443 http2 ssl;

    server_name server_IP_address;

    ssl_certificate /etc/ssl/certs/nginx-selfsigned.crt;
    ssl_certificate_key /etc/ssl/private/nginx-selfsigned.key;
    ssl_dhparam /etc/ssl/certs/dhparam.pem;

    ########################################################################
    # from https://cipherli.st/                                            #
    # and https://raymii.org/s/tutorials/Strong_SSL_Security_On_nginx.html #
    ########################################################################

    ssl_protocols TLSv1 TLSv1.1 TLSv1.2;
    ssl_prefer_server_ciphers on;
    ssl_ciphers "EECDH+AESGCM:EDH+AESGCM:AES256+EECDH:AES256+EDH";
    ssl_ecdh_curve secp384r1;
    ssl_session_cache shared:SSL:10m;
    ssl_session_tickets off;
    ssl_stapling on;
    ssl_stapling_verify on;
    resolver 203.130.2.3203.130.2.4 valid=300s;
    resolver_timeout 5s;
    # Disable preloading HSTS for now.  You can use the commented out header line that includes
    # the "preload" directive if you understand the implications.
    #add_header Strict-Transport-Security "max-age=63072000; includeSubdomains; preload";
    add_header Strict-Transport-Security "max-age=63072000; includeSubdomains";
    add_header X-Frame-Options DENY;
    add_header X-Content-Type-Options nosniff;

    ##################################
    # END https://cipherli.st/ BLOCK #
    ##################################
}

Because we are using a self-signed certificate, the SSL stapling will not be used. Nginx will simply output a warning, disable stapling for our self-signed cert, and continue to operate correctly.

Finally, add the rest of the Nginx configuration for your site. This will differ depending on your needs. We will just copy some of the directives used in the default location block for our example, which will set the document root and some error pages:

/etc/nginx/conf.d/ssl.conf
server {
    listen 443 http2 ssl;
    listen [::]:443 http2 ssl;

    server_name server_IP_address;

    ssl_certificate /etc/ssl/certs/nginx-selfsigned.crt;
    ssl_certificate_key /etc/ssl/private/nginx-selfsigned.key;
    ssl_dhparam /etc/ssl/certs/dhparam.pem;

    ########################################################################
    # from https://cipherli.st/                                            #
    # and https://raymii.org/s/tutorials/Strong_SSL_Security_On_nginx.html #
    ########################################################################

    . . .

    ##################################
    # END https://cipherli.st/ BLOCK #
    ##################################

    root /usr/share/nginx/html;

    location / {
    }

    error_page 404 /404.html;
    location = /404.html {
    }

    error_page 500 502 503 504 /50x.html;
    location = /50x.html {
    }
}

When you are finished, save and exit. This configures Nginx to use our generated SSL certificate to encrypt traffic. The SSL options specified ensure that only the most secure protocols and ciphers will be used. Note that this example configuration simply serves the default Nginx page, so you may want to modify it to meet your needs.


Create a Redirect from HTTP to HTTPS (OPTIONAL)
Create a new file called ssl-redirect.conf and open it for editing with the following command:

sudo vi /etc/nginx/default.d/ssl-redirect.conf

Then paste in this line:

/etc/nginx/default.d/ssl-redirect.conf
return 301 https://$host$request_uri/;

Save and close the file when you are finished. This configures the HTTP on port 80 (default) server block to redirect incoming requests to the HTTPS server block we configured.

Activate the Changes in Nginx
Now that we've made changes, we can restart Nginx to implement new configuration.

First, we should check to make sure that there are no syntax errors in our files. We can do this by executing:

sudo nginx -t

If everything is successful, you will get a result that looks like this:

Output
nginx: [warn] "ssl_stapling" ignored, issuer certificate not found
nginx: the configuration file /etc/nginx/nginx.conf syntax is ok
nginx: configuration file /etc/nginx/nginx.conf test is successful

Notice the warning in the beginning. As noted earlier, this particular setting throws a warning since our self-signed certificate can't use SSL stapling. This is expected and our server can still encrypt connections correctly.

If your output matches the above, your configuration file has no syntax errors. We can safely restart Nginx to implement our changes:

sudo systemctl restart nginx

The Nginx process will be restarted, implementing the SSL settings we configured.

Test Encryption

Open your web browser and type https:// followed by your server's domain name or IP into the address bar:

https://server_domain_or_IP

Because the certificate we created isn't signed by one of your browser's trusted certificate authorities, you will likely see a scary looking warning like the one below:


This is expected and normal. We are only interested in the encryption aspect of our certificate, not the third party validation of our host's authenticity. Click "ADVANCED" and then the link provided to proceed to your host anyway:


You should be taken to your site. If you look in the browser address bar, you will see some indication of partial security. This might be a lock with an "x" over it or a triangle with an exclamation point. In this case, this just means that the certificate cannot be validated. It is still encrypting your connection.

If you configured Nginx to redirect HTTP requests to HTTPS, you can also check whether the redirect functions correctly:

http://server_domain_or_IP

If this results in the same icon, this means that your redirect worked correctly.

Conclusion
You have successfully configured your Nginx server to use strong encryption for client connections. This will allow you serve requests securely, and will prevent outside access from reading your traffic.

How To Configure Multi-Factor Authentication for SSH on Ubuntu 16.04

$
0
0

Multi-factor authentication requires more than one factor in order to authenticate, or log in. This article will guide you through the steps to set up multi-factor authentication for SSH on Ubuntu 16.04 server.


Installing Google's PAM
PAM, which stands for Pluggable Authentication Module, is an authentication infrastructure used on Linux systems to authenticate a user. Because Google made an OATH-TOTP app, they also made a PAM that generates TOTPs and is fully compatible with any OATH-TOTP app, like Google Authenticator or Authy.

First, update Ubuntu's repository cache.

sudo apt-get update

installing the PAM by executing the following command

sudo apt-get install libpam-google-authenticator

initialize app with the following command

google-authenticator

You'll be prompted a few questions. The first one asks if authentication tokens should be time-based.

Do you want authentication tokens to be time-based (y/n) y

Note: Make sure you record the secret key, verification code, and the recovery codes in a safe place. The recovery codes are the only way to regain access if you, for example, lose access to your TOTP app.

The remaining questions inform the PAM how to function. We'll go through them one by one.

Do you want me to update your "~/.google_authenticator" file (y/n) y

This writes the key and options to the .google_authenticator file. If you say no, the program quits and nothing is written, which means the authenticator won't work.

Do you want to disallow multiple uses of the same authentication
token? This restricts you to one login about every 30s, but it increases
your chances to notice or even prevent man-in-the-middle attacks (y/n) y

By answering yes here, you are preventing a replay attack by making each code expire immediately after use. This prevents an attacker from capturing a code you just used and logging in with it.

By default, tokens are good for 30 seconds and in order to compensate for
possible time-skew between the client and the server, we allow an extra
token before and after the current time. If you experience problems with poor
time synchronization, you can increase the window from its default
size of 1:30min to about 4min. Do you want to do so (y/n) n

Answering yes here allows up to 8 valid codes in a moving four minute window. By answering no, you limit it to 3 valid codes in a 1:30 minute rolling window. Unless you find issues with the 1:30 minute window, answering no is the more secure choice.

If the computer that you are logging into isn't hardened against brute-force
login attempts, you can enable rate-limiting for the authentication module.
By default, this limits attackers to no more than 3 login attempts every 30s.
Do you want to enable rate-limiting (y/n) y

Rate limiting means a remote attacker can only attempt a certain number of guesses before being blocked. If you haven't previously configured rate limiting directly into SSH, doing so now is a great hardening technique.

Note: Once you finish this setup, if you want to back up your secret key, you can copy the ~/.google-authenticator file to a trusted location. From there, you can deploy it on additional systems or redeploy it after a backup.

Now that Google's PAM is installed and configured, the next step is to configure SSH to use your TOTP key. We'll need to tell SSH about the PAM and then configure SSH to use it.

Configuring OpenSSH
Now, we'll be making SSH changes over SSH, it's important to never close your initial SSH connection. Instead, open a second SSH session to do testing. This is to avoid locking yourself out of your server if there was a mistake in your SSH configuration. Once everything works, then you can safely close any sessions.

To start open up the sshd configuration file for editing using nano or your favorite text editor.

sudo nano /etc/pam.d/sshd

Add the following line to the bottom of the file.

/etc/pam.d/sshd
. . .
# Standard Un*x password updating.
@include common-password
auth required pam_google_authenticator.so nullok

The nullok word at the end of the last line tells the PAM that this authentication method is optional. This allows users without a OATH-TOTP token to still log in using their SSH key. Once all users have an OATH-TOTP token, you can remove nullok from this line to make MFA mandatory.

Save and close the file.

Next, we'll configure SSH to support this kind of authentication. Open the SSH configuration file for editing.

sudo nano /etc/ssh/sshd_config

Look for ChallengeResponseAuthentication and set its value to yes.

/etc/ssh/sshd_config
. . .
# Change to yes to enable challenge-response passwords (beware issues with
# some PAM modules and threads)
ChallengeResponseAuthentication yes
. . .

Save and close the file, then restart SSH to reload the configuration files. Restarting the sshd service won't close open connections, so you won't risk locking yourself out with this command.

sudo systemctl restart sshd.service

To test that everything's working so far, open another terminal and try logging in over SSH. If you've previously created an SSH key and are using it, you'll notice you didn't have to type in your user's password or the MFA verification code. This is because an SSH key overrides all other authentication options by default. Otherwise, you should have gotten a password and verification code prompt.

Next, to enable an SSH key as one factor and the verification code as a second, we need to tell SSH which factors to use and prevent the SSH key from overriding all other types.

Making SSH Aware of MFA
Reopen the sshd configuration file.

sudo nano /etc/ssh/sshd_config

Add the following line at the bottom of the file. This tells SSH which authentication methods are required. This line tells SSH we need a SSH key and either a password or a verification code (or all three).

/etc/ssh/sshd_config
. . .
UsePAM yes
AuthenticationMethods publickey,password publickey,keyboard-interactive

Save and close the file.

Next, open the PAM sshd configuration file again.

sudo nano /etc/pam.d/sshd

Find the line @include common-auth and comment it out by adding a # character as the first character on the line. This tells PAM not to prompt for a password.

/etc/pam.d/sshd
. . .
# Standard Un*x authentication.
#@include common-auth
. . .

Save and close the file, then restart SSH.

sudo systemctl restart sshd.service

Now try logging into the server again with a different session. Unlike last time, SSH should ask for your verification code. Upon entering it, you'll be logged in. Even though you don't see any indication that your SSH key was used, your login attempt used two factors. If you want to verify, you can add -v (for verbose) after the SSH command:

Example SSH output\
. . .
debug1: Authentications that can continue: publickey
debug1: Next authentication method: publickey
debug1: Offering RSA public key: /Users/sammy/.ssh/id_rsa
debug1: Server accepts key: pkalg rsa-sha2-512 blen 279
Authenticated with partial success.
debug1: Authentications that can continue: password,keyboard-interactive
debug1: Next authentication method: keyboard-interactive
Verification code:

Towards the end of the output, you'll see where SSH uses your SSH key and then asks for the verification code. You can now log in over SSH with a SSH key and a one-time password. If you want to enforce all three authentication types, you can follow the next step.

Adding a Third Factor (Optional)
In above step, we listed the approved types of authentication in the sshd_config file:

  1. publickey (SSH key)
  2. password publickey (password)
  3. keyboard-interactive (verification code)


Although we listed three different factors, with the options we've chosen so far, they only allow for an SSH key and the verification code. If you'd like to have all three factors (SSH key, password, and verification code), one quick change will enable all three.

Open the PAM sshd configuration file.

sudo nano /etc/pam.d/sshd

Locate the line you commented out previously, #@include common-auth, and uncomment the line by removing the # character. Save and close the file. Now once again, restart SSH.

sudo systemctl restart sshd.service


By enabling the option @include common-auth, PAM will now prompt for a password in addition the checking for an SSH key and asking for a verification code, which we had working previously. Now we can use something we know (password) and two different types of things we have (SSH key and verification code) over two different channels.

Conclusion
Having two factors (an SSH key + MFA token) across two channels (your computer + your phone), you've made it very difficult for an outside intruder to brute force their way into your machine via SSH and greatly increased the security of your machine.

Installing ionCube on Ubuntu 16.04

$
0
0

ionCube is a PHP module extension that loads encrypted PHP files and speeds up webpages. It is commonly required for PHP-based applications. This article will guide you through the steps to install ionCube on a Ubuntu 16.04 server.


To follow the steps mentioned in this guide, you will need One Ubuntu 16.04 server with a sudo non-root user and a web server with PHP installed, such as Apache or Nginx.

Choosing the Right ionCube Version
It is important that the version of ionCube you choose matches your PHP version, so first, you need to know:

  • The version of PHP our web server is running, and
  • If it is 32-bit or 64-bit.


If you have a 64-bit Ubuntu server, you are probably running 64-bit PHP, but let's make sure. To do so, we'll use a small PHP script to retrieve information about our server's current PHP configuration.

Create a file called info.php file in the root directory of your web server (likely /var/www/html, unless you've changed it) using nano or your favorite text editor.

sudo nano /var/www/html/info.php

Paste the following inside the file, then save and close it.

phpinfo();

After saving the changes to the file, visit http://your_server_ip/info.php in your favorite browser. The web page you've opened should look something like this:


We're running 7.0.8. x86_64 64-bit PHP; if it ends with i686, it's 32-bit.

With this information, you can proceed with the download and installation.

Setting Up ionCube
Go to the ionCube download page and find the appropriate download link based on your OS. In our example, we need the this 64-bit Linux version. Copy the tar.gz link on the site and download the file.

wget http://downloads3.ioncube.com/loader_downloads/ioncube_loaders_lin_x86-64.tar.gz

Now, extract the archive.

tar xvfz ioncube_loaders_lin_x86-64.tar.gz

This creates a directory named ioncube which contains various files for various PHP versions. Choose the right folder for your PHP version. In our example, we need the file PHP version 7.0, which is ioncube_loader_lin_7.0.so. We will copy this file to the PHP extensions folder.

To find out the path of the extensions folder, check the http://your_server_ip/info.php page again and search for extension_dir.


In our example, it's /usr/lib/php/20151012, so copy the file there:

sudo cp ioncube/ioncube_loader_lin_7.0.so /usr/lib/php/20151012/

For PHP to load the extension, we need to add it to the PHP configuration. We can do it in the main php.ini PHP configuration file, but it's cleaner to create a separate file. We can set this separate file to load before other extensions to avoid possible conflicts.

To find out where we should create the custom configuration file, look at http://your_server_ip/info.php again and search for Scan this dir for additional .ini files.


So, we'll create a file named 00-ioncube.ini inside the /etc/php/7.0/apache2/conf.d directory. The 00 at the beginning of the filename ensures this file will be loaded before other PHP configuration files.

sudo nano /etc/php/7.0/apache2/conf.d/00-ioncube.ini

Paste the following loading directive, then save and close the file.

zend_extension = "/usr/lib/php/20151012/ioncube_loader_lin_7.0.so"

For the above change to take effect, we will need to restart the web server.

If you are using Apache, run:

sudo systemctl restart apache2.service

If you are using Nginx, run:

sudo systemctl restart nginx

You may also need to restart php-fpm, if you're using it.

sudo systemctl restart php7.0-fpm.service

Finally, let's make sure that the PHP extension is installed and enabled.

Verifying the ionCube Installation
Back on the http://your_server_ip/info.php page, refresh the page and search for the "ionCube" keyword. You should now see with the ionCube PHP Loader (enabled):


It confirms that the PHP ionCube extension is loaded on your server.

It can be a bit of a security risk to keep the info.php script, as it allows potential attackers to see information about your server, so remove it now.

sudo rm /var/www/html/info.php

You can also safely remove the extra downloaded ionCube files which are no longer necessary.

sudo rm ioncube_loaders_lin_x86-64.tar.gz
sudo rm -rf ioncube_loaders_lin_x86-64


Conclusion
ionCube is now fully set up and functional.

Migrating Active Directory FSMO Roles From Windows 2012 R2 to Windows 2016

$
0
0

This article will guide you through the steps to transfer active directory FSMO roles from Windows Server 2012 R2 to Windows Server 2016.  For this guide, example.com will be my domain name. I have a Windows Server 2012 R2 domain controller as PDC (source server) and one Windows Server 2016 (target server) which I have already added to my existing domain.


Current domain and forest functional level of the domain is Windows Server 2012 R2.


Let's begin with the migration process.

Installing Active Directory on Windows Server 2016

1. Log in to windows server 2016 as domain administrator or enterprise administrator
2. Check the IP address details and set the localhost (127.0.0.1) IP address as the primary DNS and another AD server as secondary DNS. This is because after AD install, server itself will act as DNS server
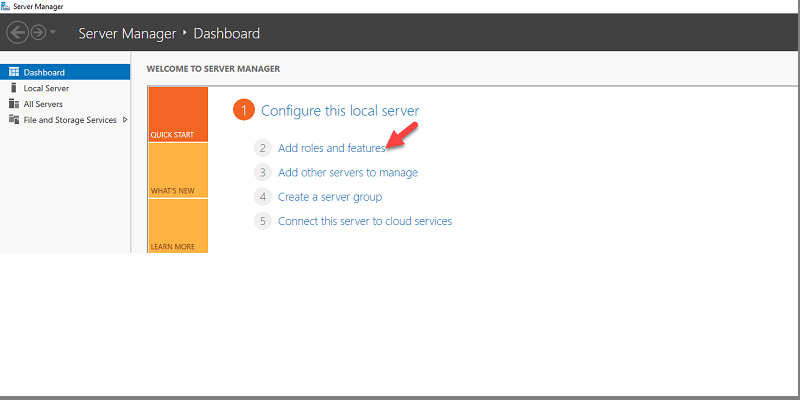
3. Run servermanager.exe form PowerShell to open server manager.


4. Then click on Add Roles and Features


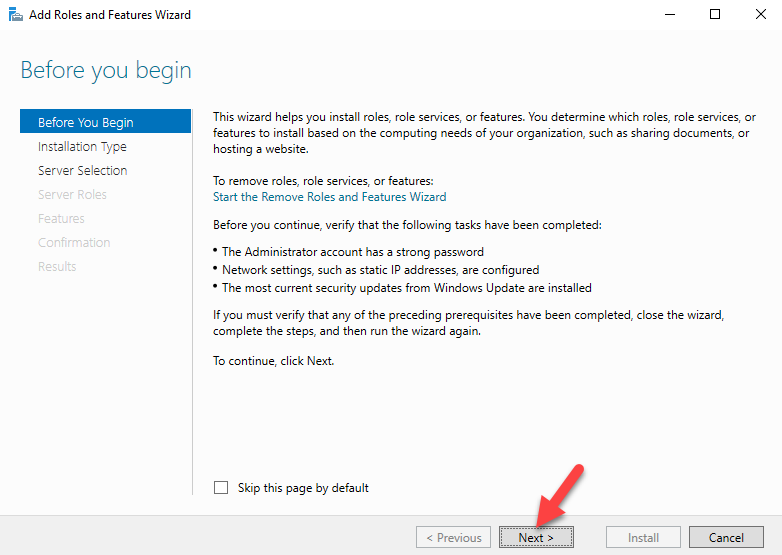
5. It will open up the Add Roles and Feature Wizard, click next to continue


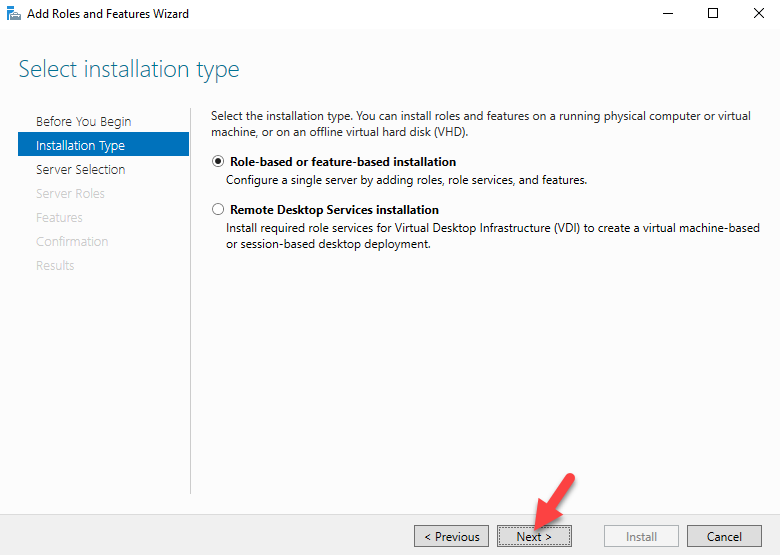
6. Keep the default selection and Click next


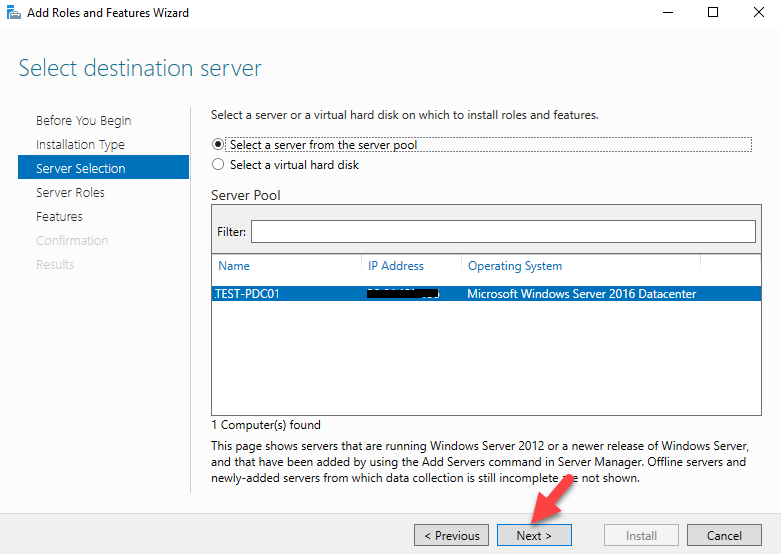
7. Select your server and click next to continue


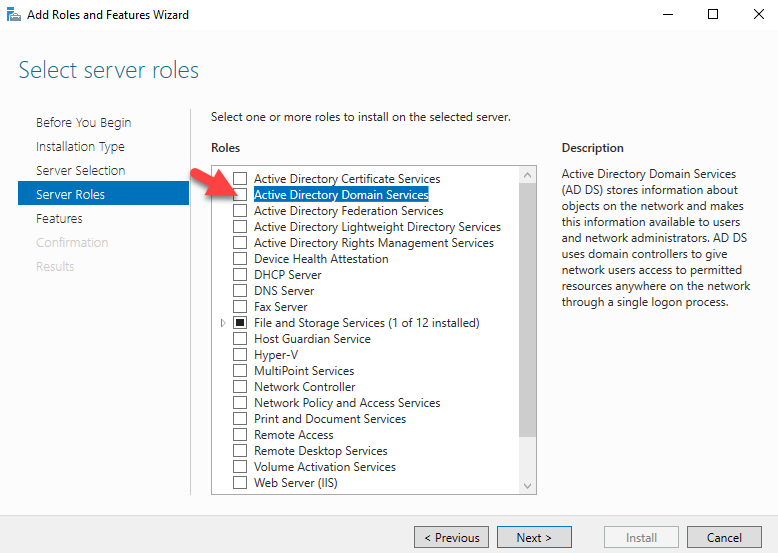
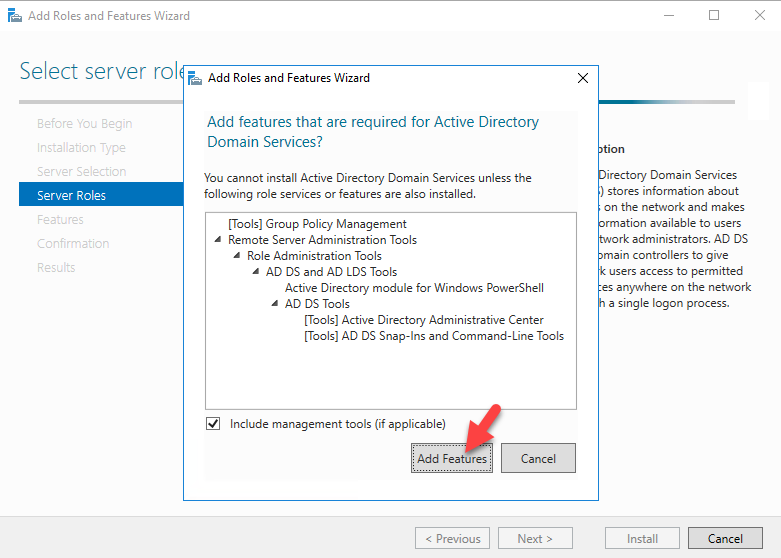
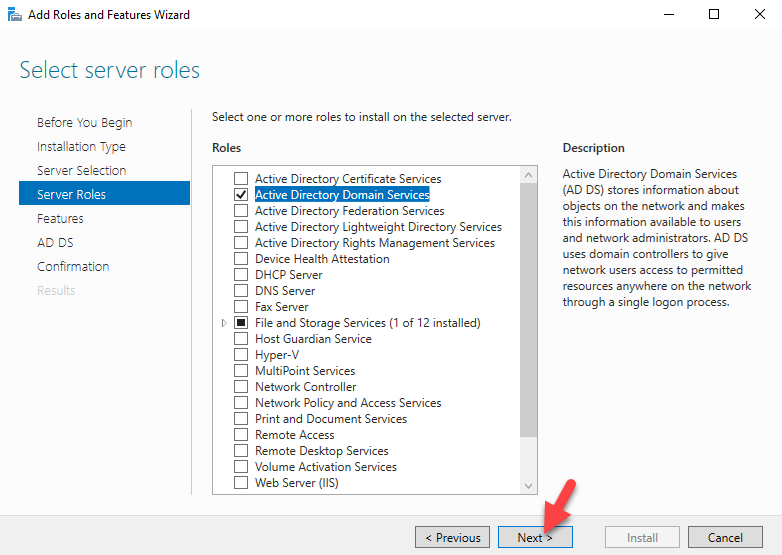
8. Under the server roles click on Active Directory Domain Services, it will then prompt with the features needs for the role. Click on add features. Then click next to proceed


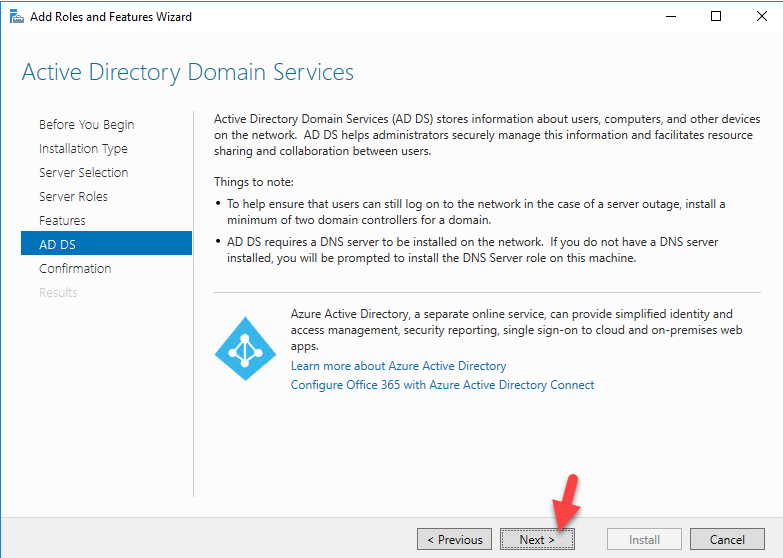
9. Keep the default selection and click next


10. Click next to proceed


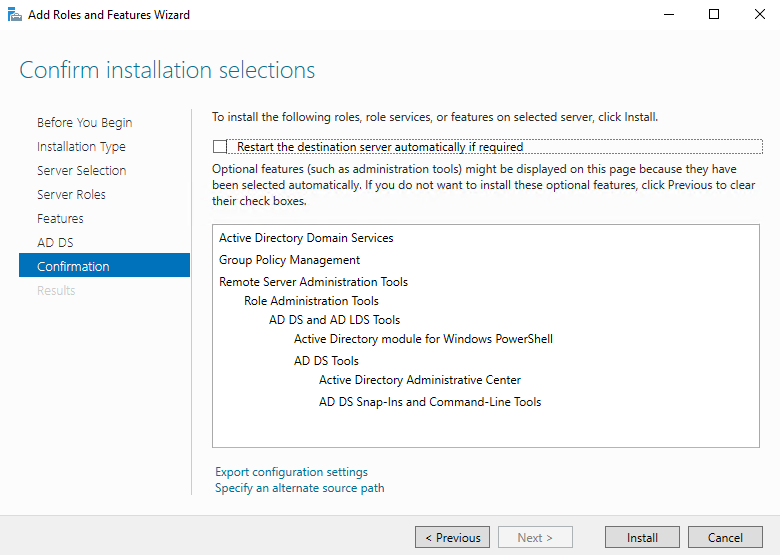
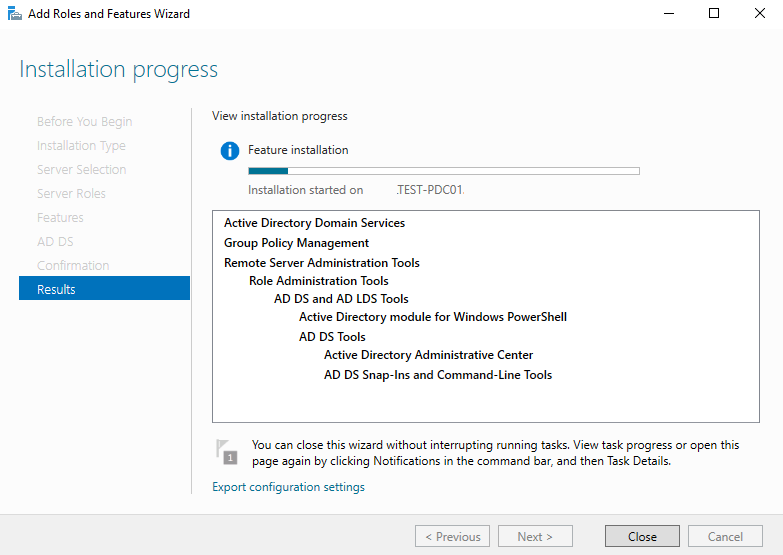
11. Click on install to start the role installation process.


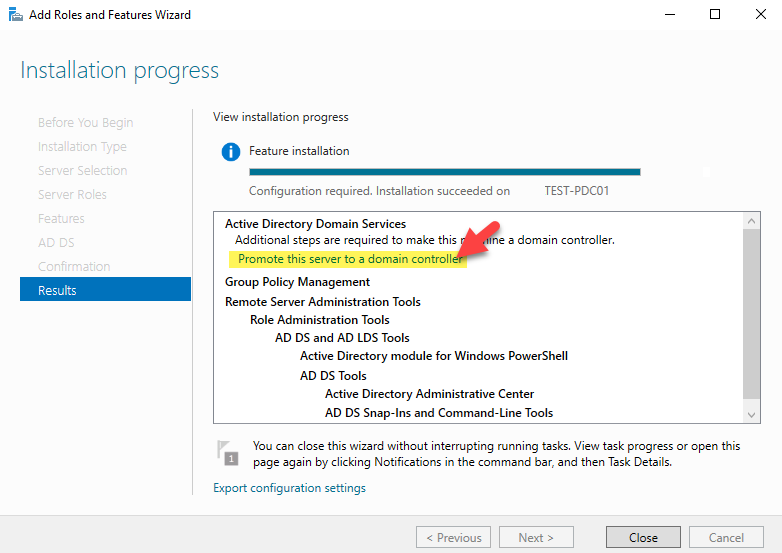
12. Once installation completed, click on promote this server to a domain controller option


13. Active Directory Domain Service configuration wizard, keep the option Add a domain controller to existing domain selected and click next.


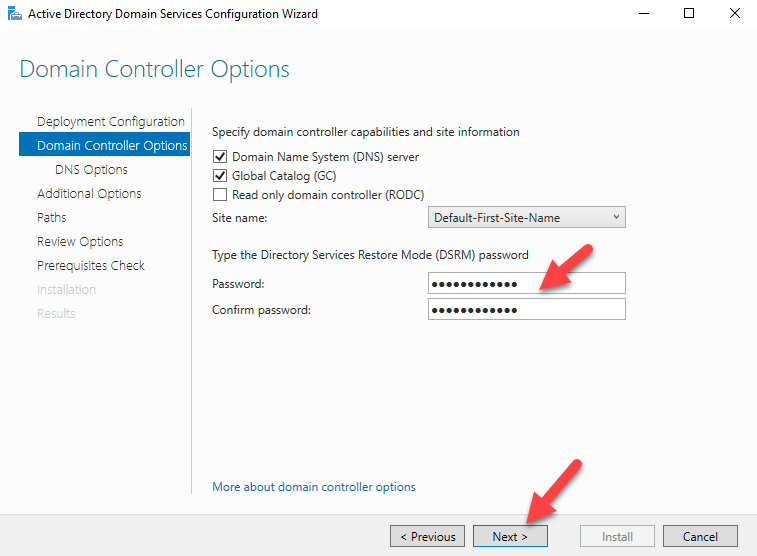
14. Provide a DSRM password and click next


15. Click on next to proceed


16. From where to replicate domain information. You can select the specific server or leave it default. Once done click next to proceed.


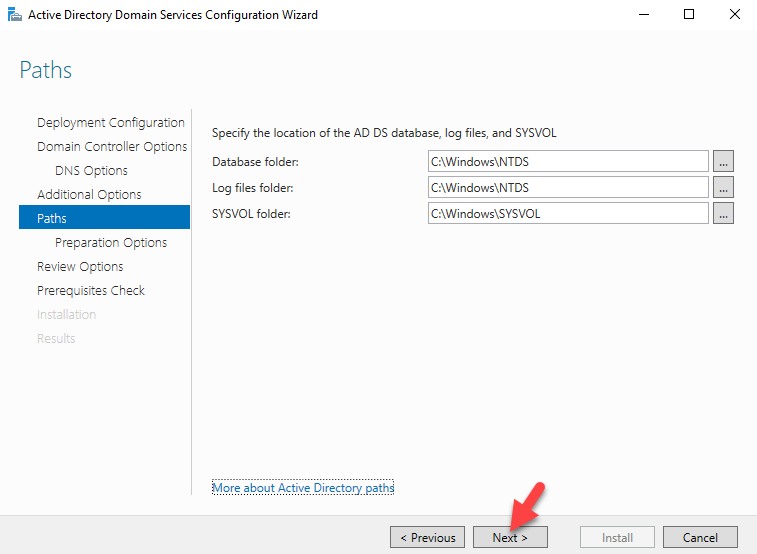
17. You can change the paths or keep the default. Click next to continue


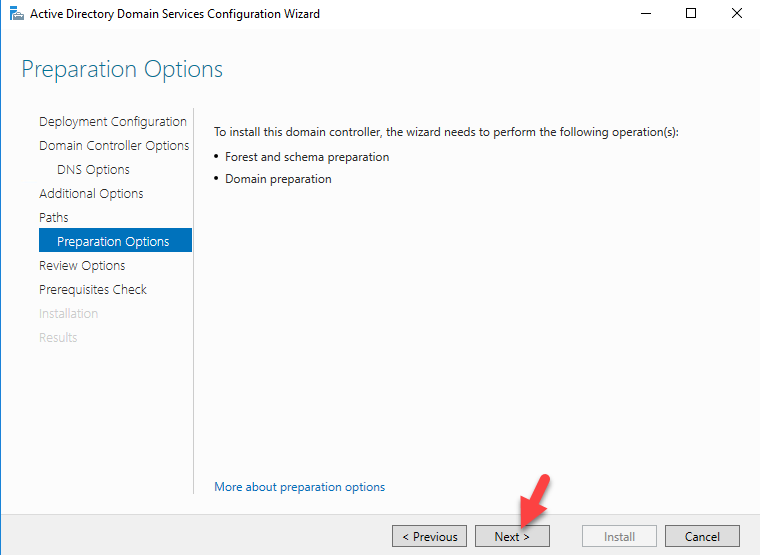
18. Since this is the first Windows Server 2016 AD domain, it will run forest and domain preparation task. Click next to proceed.


19. Click next to proceed.


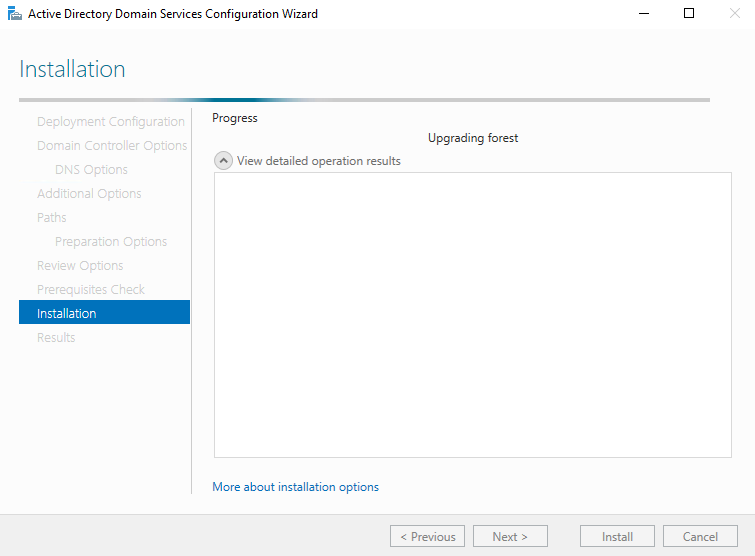
20. Then it will run prerequisite check, if all well then click on install to start the configuration process.


21. Once the installation completes it will restart the server.


Migrating FSMO Roles to Windows Server 2016 AD
There are 2 methods to transfer the FSMO roles from one server to another. One is using GUI and other one is command line. Since I am more comfortable with command line so I'll be using PowerShell to transfer FSMO roles from Windows 2012 R2 to Windows Server 2016.

1. Log in to Windows Server 2016 AD as enterprise administrator
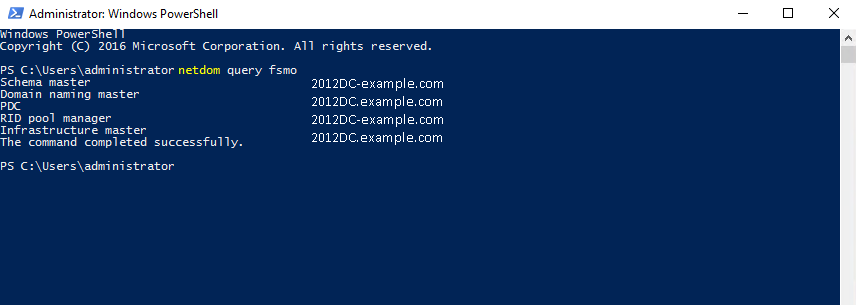
2. Open up the PowerShell as administrator. Then execute netdom query fsmo command. This will list down the FSMO roles and its current owner. 


3. In our example, the Windows Server 2012 R2 AD server holds all 5 fsmo roles. To transfer FSMO toles, execute the following command

Move-ADDirectoryServerOperationMasterRole -Identity TEST-PDC01 -OperationMasterRole SchemaMaster, DomainNamingMaster, PDCEmulator, RIDMaster, InfrastructureMaster

and press enter

In our example, TEST-PDC01 is the Windows Server 2016 DC. If FSMO roles are placed on different servers in your environment, you can migrate each and every FSMO roles to different servers. 


4. Once its completed, execute netdom query fsmo again and now you can see its Windows Server 2016 DC is the new FSMO roles owner.


Uninstalling AD role from Windows Server 2012 R2

We have successfully transfered FSMO roles, but still domain and forest functional levels running on Windows 2012 R2 . In order to upgrade it, first we need to decommission AD roles from existing Windows Server 2012 R2 servers. 

1. Log in to Windows 2012 R2 domain server as enterprise administrator
2. Open the PowerShell as administrator
3. Execute the following command 

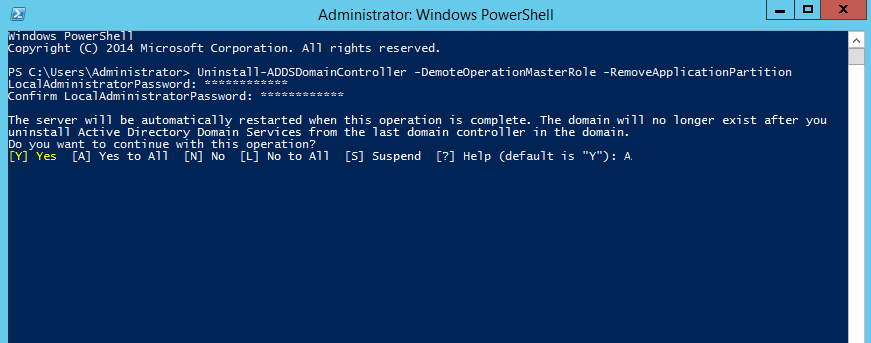
Uninstall-ADDSDomainController -DemoteOperationMasterRole -RemoveApplicationPartition

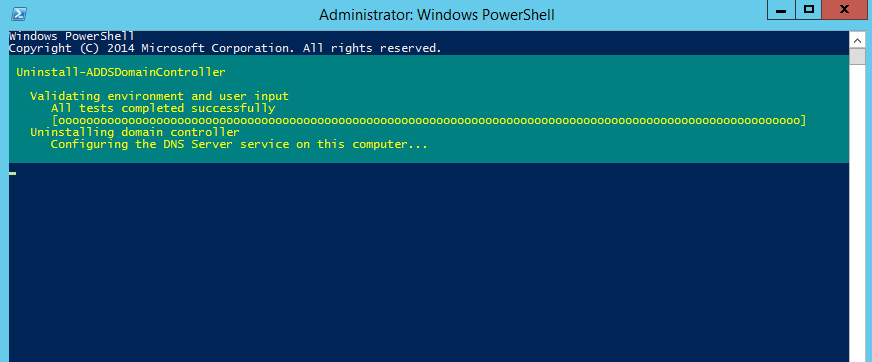
and press enter. It will ask for local administrator password. provide new password for local administrator and press enter.


4. Once its completed it will restart the server.


Upgrading the forest and domain functional levels to Windows Server 2016
Since we have demoted Windows Server 2012 R2 domain controller, next step is to upgrade domain and forest functional levels. 
1. Log in to Windows Server 2016 DC as enterprise administrator 
2. Open PowerShell as administrator
3. Execute the following command

Set-ADDomainMode –identity rebeladmin.net -DomainMode Windows2016Domain to upgrade domain functional level to Windows Server 2016.  In our example, example.com is the domain name. 


4. Now type Set-ADForestMode -Identity rebeladmin.net -ForestMode Windows2016Forest to upgrade forest functional level.


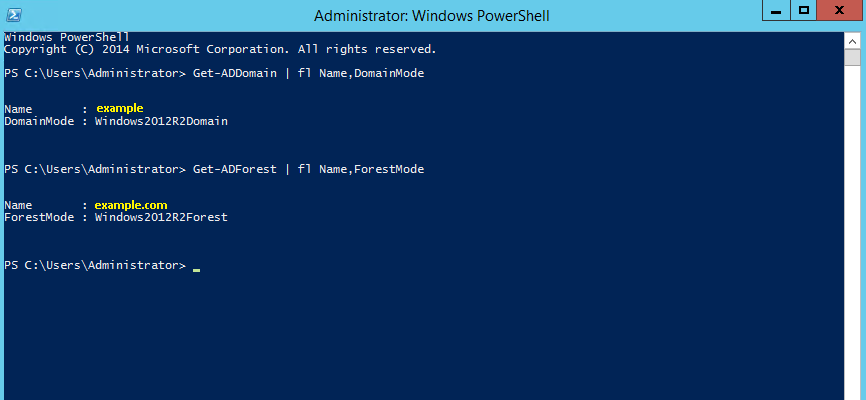
5. Once completed, you can run Get-ADDomain | fl Name,DomainMode and Get-ADForest | fl Name,ForestMode to confirm new domain and functional level


That's all for now.


How To Set Up Linux Firewall for Docker Swarm on CentOS 7

$
0
0

Docker Swarm is a feature of Docker that makes it easy to run Docker hosts and containers at scale. A Docker Swarm, or Docker cluster, is made up of one or more hosts that function as manager nodes, and any number of worker nodes. Setting up such a system requires careful manipulation of the Linux firewall.


This article will guide you through the steps to configure linux firewall for docker swarm on CentOS 7 using FirewallD and IPTables.

The network ports required for a Docker Swarm to function properly are:

  • TCP port 2376 for secure Docker client communication. This port is required for Docker Machine to work. Docker Machine is used to orchestrate Docker hosts.
  • TCP port 2377. This port is used for communication between the nodes of a Docker Swarm or cluster. It only needs to be opened on manager nodes.
  • TCP and UDP port 7946 for communication among nodes (container network discovery).
  • UDP port 4789 for overlay network traffic (container ingress networking).


Note: Aside from those ports, port 22 (for SSH traffic) and any other ports needed for specific services to run on the cluster have to be open.

Prerequisites
I assume you have already set up the hosts that make up your cluster, including at least one swarm manager and one swarm worker. 

Note: You'll notice that the commands (and all the commands in this article) are not prefixed with sudo. That's because it's assumed that you're logged into the server using the docker-machine ssh command after provisioning it using Docker Machine.

Open Docker Swarm Ports Using FirewallD
FirewallD is the default firewall application on CentOS 7, but on a new CentOS 7 server, it is disabled out of the box. So let's enable it and add the network ports necessary for Docker Swarm to function.

Before starting, verify its status:

systemctl status firewalld

It should not be running, so start it:

systemctl start firewalld

Then enable it so that it starts on boot:

systemctl enable firewalld

On the node that will be a Swarm manager, use the following commands to open the necessary ports:

firewall-cmd --add-port=2376/tcp --permanent
firewall-cmd --add-port=2377/tcp --permanent
firewall-cmd --add-port=7946/tcp --permanent
firewall-cmd --add-port=7946/udp --permanent
firewall-cmd --add-port=4789/udp --permanent

Note: If you make a mistake and need to remove an entry, type:

firewall-cmd --remove-port=port-number/tcp —permanent. 

Afterwards, reload the firewall:

firewall-cmd --reload

Then restart Docker.

systemctl restart docker

Then on each node that will function as a Swarm worker, execute the following commands:

firewall-cmd --add-port=2376/tcp --permanent
firewall-cmd --add-port=7946/tcp --permanent
firewall-cmd --add-port=7946/udp --permanent
firewall-cmd --add-port=4789/udp --permanent

Afterwards, reload the firewall:

firewall-cmd --reload

Then restart Docker.

systemctl restart docker

You've successfully used FirewallD to open the necessary ports for Docker Swarm.

Note: If you'll be testing applications on the cluster that require outside network access, be sure to open the necessary ports. For example, if you'll be testing a Web application that requires access on port 80, add a rule that grants access to that port using the following command on all the nodes (managers and workers) in the cluster:

firewall-cmd --add-port=80/tcp --permanent

Remember to reload the firewall when you make this change.

Open Docker Swarm Ports Using IPTables
To use IPTables on any Linux distribution, you'll have to first uninstall any other firewall utilities. To switch to IPTables from FirewallD, first stop FirewallD:

systemctl stop firewalld

Then disable it

systemctl disable firewalld

Then install the iptables-services package, which manages the automatic loading of IPTables rules:

yum install iptables-services

Next, start IPTables:

systemctl start iptables

Then enable it so that it automatically starts on boot:

systemctl enable iptables

Before you start adding Docker Swarm-specific rules to the INPUT chain, let's take a look at the default rules in that chain:

iptables -L INPUT --line-numbers 

The output should look exactly like this:

Output
Chain INPUT (policy ACCEPT)
num  target     prot opt source               destination         
1    ACCEPT     all  --  anywhere             anywhere             state RELATED,ESTABLISHED
2    ACCEPT     icmp --  anywhere             anywhere            
3    ACCEPT     all  --  anywhere             anywhere            
4    ACCEPT     tcp  --  anywhere             anywhere             state NEW tcp dpt:ssh
5    REJECT     all  --  anywhere             anywhere             reject-with icmp-host-prohibited

Taken together, the default rules provide stateful protection for the server, denying all input traffic except those that are already established. SSH traffic is allowed in. Pay attention to rule number 5, highlighted above, because it's a catchall reject rule. For your Docker Swarm to function properly, the rules you add need to be added above this rule. That means the new rules need to be inserted, instead of appended to the INPUT chain.

Now that you know what to do, you can add the rules you need by using the iptables utility. This first set of commands should be executed on the nodes that will serve as Swarm managers.

iptables -I INPUT 5 -p tcp --dport 2376 -j ACCEPT
iptables -I INPUT 6 -p tcp --dport 2377 -j ACCEPT
iptables -I INPUT 7 -p tcp --dport 7946 -j ACCEPT
iptables -I INPUT 8 -p udp --dport 7946 -j ACCEPT
iptables -I INPUT 9 -p udp --dport 4789 -j ACCEPT

Those rules are runtime rules and will be lost if the system is rebooted. To save the current runtime rules to a file so that they persist after a reboot, type:

/usr/libexec/iptables/iptables.init save

The rules are now saved to a file called iptables in the /etc/sysconfig directory. And if you view the rules using iptables -L --line-numbers, you'll see that all the rules have been inserted above the catch-all reject rule:

Output
Chain INPUT (policy ACCEPT)
num  target     prot opt source               destination         
1    ACCEPT     all  --  anywhere             anywhere             state RELATED,ESTABLISHED
2    ACCEPT     icmp --  anywhere             anywhere            
3    ACCEPT     all  --  anywhere             anywhere            
4    ACCEPT     tcp  --  anywhere             anywhere             state NEW tcp dpt:ssh
5    ACCEPT     tcp  --  anywhere             anywhere             tcp dpt:2376
6    ACCEPT     tcp  --  anywhere             anywhere             tcp dpt:7946
7    ACCEPT     udp  --  anywhere             anywhere             udp dpt:7946
8    ACCEPT     udp  --  anywhere             anywhere             udp dpt:4789
9    ACCEPT     tcp  --  anywhere             anywhere             tcp dpt:http
10   REJECT     all  --  anywhere             anywhere             reject-with icmp-host-prohibited

Then restart Docker.

Output
systemctl restart docker

On the nodes that will function as Swarm workers, execute these commands:

iptables -I INPUT 5 -p tcp --dport 2376 -j ACCEPT
iptables -I INPUT 6 -p tcp --dport 7946 -j ACCEPT
iptables -I INPUT 7 -p udp --dport 7946 -j ACCEPT
iptables -I INPUT 8 -p udp --dport 4789 -j ACCEPT

Save the rules to disk:

/usr/libexec/iptables/iptables.init save

Then restart Docker:

systemctl restart docker

That's all it takes to open the necessary ports for Docker Swarm using IPTables.

Note: If you'll be testing applications on the cluster that requires outside network access, be sure to open the necessary ports. For example, if you'll be testing a Web application that requires access on port 80, add a rule that grants access to that port using the following command on all the nodes (manager and workers) in the cluster:

iptables -I INPUT rule-number -p tcp --dport 80 -j ACCEPT

Be sure to insert the rule above the catchall reject rule. 


Conclusion
FirewallD and IPTables are two of the most popular firewall management applications in the Linux world. You just read how to use these to open the network ports needed to set up Docker Swarm. The method you use is just a matter of personal preference, because they are all equally capable.

Active Directory Time-bound Group Membership in Windows Server 2016

$
0
0

Active Directory Expiring Links is new feature in Windows Server 2016 which enables time-bound group membership, expressed by a time-to-live (TTL) value. It allows administrators to assign temporally group membership. This feature is not enabled by default because it required forest function level must be Windows Server 2016. Also, once this feature is enabled, it cannot be disabled. 


This article will guide you through the steps to enable active directory time-bound group membership in Windows Server 2016.

Open up PowerShell and execute the following command to enable time-bound feature in active directory.

Enable-ADOptionalFeature ‘Privileged Access Management Feature’ -Scope ForestOrConfigurationSet -Target example.com

example.com should be replaced with your domain name.

Now, I have a user called Jhon which I need to assign Domain Admin group membership for 20 minutes

List the current member of domain admin group by executing the following command

Get-ADGroupMember “Domain Admins”

Next step is to add the Jhon to the domain admin group for 20 minutes.


Add-ADGroupMember -Identity ‘Domain Admins’ -Members ‘jhon’ -MemberTimeToLive (New-TimeSpan -Minutes 20)

Verify the TTL group membership for user Jhon with the following command


Get-ADGroup ‘Domain Admins’ -Property member -ShowMemberTimeToLive

The group membership will automatically be expired after 20 minutes.


That's all for now.


How to Convert PDF to MS Office Files in 3 Quick Steps

$
0
0

This article will guide you through the steps to convert PDF to MS Office Files. For demonstrations sake we’ll focus on PDF to Word, but the steps are identical for Excel and PowerPoint.


Undeniably popular and regularly used all across the globe for a time period spanning over three decades, Microsoft Office programs have been a staple in contemporary business without any serious rivals. Besides corporate practices, they have also been employed in education to a great extent. With the exception of Outlook, which has been surpassed by free online services in the likes of Gmail and Yahoo Mail, Word, Excel and PowerPoint still remain reigning champions of their respected fields.

Ever since the expansion of the world wide web, one particular problem has plagued Office users (and still does to this day), and that is the complications that arise from sharing Office-based documents between computers and other devices. Because there are so many different operating systems both for computers and also for tablets/smartphones, and each of them read the formatting of every specific file in their own unique way, there is a grand possibility that you won’t be able to view the file in its entirety if it was sent from a device that has a different OS than yours. Most likely the file will be riddled with glitches and bugs.

The way to overcome this vexing issue for all three programs is to convert them to PDF before sending the files to someone else, and that can be done directly from inside each of the programs. The way the PDF works is that it takes all the data inside of a file (fonts, graphics etc), and re-arranges it in a universally readable manner, thus making it viewable on all computers and devices. On the other hand, the main flaw of the Portable Document Format (once it’s created from another file), is that it cannot be edited in a regular fashion, because it requires a specially designed tool that can extract all the data inside the read-only PDF, and return the file back to its original editable MS Office state.

These types of programs usually require some kind of payment, and for users who experience this type of need on a regular basis, it is money well spent. But for people who don’t depend on this conversion regularly, there are free online tools which don’t have the same kind of precision options as the paid versions, but offer great results themselves. Of course, finding the proper tool in a sea of similar tools can really be a nightmare, so we wanted to share with you a tool which is very simple for using, and at the same time offers splendid results.

Let's get started.


1. The first thing needed to be done when using PDF Converter’s PDF to Word Online tool is selecting the desired file.


2. Once the file is converted, it will be sent to your email address from the company’s server, so the second step is entering your valid mail.


3. Just click the start button to begin the process, and expect the download link in your inbox a few minutes later. The time needed is usually very short, depending on the number of users and the size of the file itself (there is no limit to the size of the file by the way).


Conclusion
So there you have it, a very simple solution to a somewhat complicated problem. Make sure to try it out when a tricky PDF comes your way, and take some of the pressure off in no-time!

How To Protect PostgreSQL Against Automated Attacks

$
0
0

Remote access is one of the common and more easily rectified situations that can lead to the exploit of a PostgreSQL database. However, many exploits are automated and specifically designed to look for common errors in configuration. These programs scan networks to discover servers, independent of the nature of the content.


This article will show you how to mitigate the specific risk posed by allowing remote connections to database which is an important step to look in first, but servers can be compromised in other ways too.

For this particular guide, we'll use two Ubuntu machines, one for the database host and one as the client that will be connecting to the host remotely. Each one should have a sudo user and the firewall enabled.

Ubuntu 16.04 PostgreSQL Database Machine:
If you haven't install PostgreSQL yet, you can do so with the following commands:

sudo apt-get update
sudo apt-get install postgresql postgresql-contrib

Ubuntu 16.04 Client Machine:
In order to demonstrate and test allowing remote connections, we'll use the PostgreSQL client, psql. To install it, use the following commands:

sudo apt-get update
sudo apt-get install postgresql-client

When you are done with prerequisites above, you're ready to move to next step.

Understanding the Default Configuration
When PostgreSQL is installed from the Ubuntu packages, by default it is restricted to listening on localhost. This default can be changed by overriding the listen_addresses in the postgresql.conf file, but the default prevents the server from automatically listening on a public interface.

In addition, the pg_hba.conf file only allows connections from Unix/Linux domain sockets and the local loopback address for the server, so it wouldn’t accept connections from external hosts:


replace
# Put your actual configuration here
# ----------------------------------
#
# If you want to allow non-local connections, you need to add more
# "host" records. In that case you will also need to make PostgreSQL
# listen on a non-local interface via the listen_addresses
# configuration parameter, or via the -i or -h command line switches.

# DO NOT DISABLE!
# If you change this first entry you will need to make sure that the
# database superuser can access the database using some other method.
# Noninteractive access to all databases is required during automatic
# maintenance (custom daily cronjobs, replication, and similar tasks).
#
# Database administrative login by Unix domain socket
local all postgres peer

# TYPE DATABASE USER ADDRESS METHOD

# "local" is for Unix domain socket connections only
local all all peer
# IPv4 local connections:
host all all 127.0.0.1/32 md5
# IPv6 local connections:
host all all ::1/128 md5
These defaults meet the objective of not listening on a public interface. If we leave them intact and keep our firewall up, we're done!

If you need to connect from a remote host, we’ll cover how to override the defaults as well as the immediate steps you can take to protect the server in the next section.

Configuring Remote Connections
For a production setup and before we start working with sensitive data, ideally we'll have PostgreSQL traffic encrypted with SSL in transit, secured behind an external firewall, or protected by a virtual private network (VPN). As we work toward that, we can take the somewhat less complicated step of enabling a firewall on our database server and restricting access to the hosts that need it.

Adding a User and Database
We'll begin by adding a user and database that will allow us to test our work. To do so, we'll use the PostgreSQL client, psql, to connect as the administrative user postgres. By passing the -i option to sudo we'll run the postgres user's login shell, which ensures that we load options from the .profile or other login-specific resources. -u species the postgres user:

sudo -i -u postgres psql

Next, we'll create a user with a password. Be sure to use secure password in place of the example highlighted below:

postgres=# CREATE USER peter WITH PASSWORD 'password';

When the user is successfully created, we should receive the following output:

Output
CREATE ROLE

Note: Since PostgreSQL 8.1, ROLES and USERS are synonymous. By convention, a role that has a password is still called a USER, while a role that does not is called a ROLE, so sometimes we will see ROLE in output where we might expect to see USER.

Next, we'll create a database and grant full access to our new user. Best practices recommend that we grant users only the access that they need and only on the resources where they should have them, so depending on the use case, it may be appropriate to restrict a user's access even more. 

postgres=# CREATE DATABASE peterdb OWNER peter;

When the database is created successfully, we should receive confirmation:

Output
CREATE DATABASE

Now, that we've created a user and database, we'll exit the monitor

postgres=# \q

After pressing ENTER, we'll be at the command prompt and ready to continue.

Configuring UFW
Before we start our configuration, let's verify firewall's status:

sudo ufw status

Note: If the output indicates that the firewall is inactive we can activate it with:

sudo ufw enable

Once it's enabled, rerunning the status command, sudo ufw status will show the current rules. If necessary, be sure to allow SSH.

sudo ufw allow OpenSSH

Unless we made changes to the prerequisites, the output should show that only OpenSSH is allowed:

Output
Status: active

To                         Action      From
--                         ------      ----
OpenSSH                    ALLOW       Anywhere
OpenSSH (v6)               ALLOW       Anywhere (v6)

Now that we've checked the firewall status, we will allow access to the PostgreSQL port and restrict it to the host or hosts we want to allow.

The command below will add the rule for the PostgreSQL default port, which is 5432. If you've changed that port, be sure to update it in the command below. Make sure that you've used the IP address of the server that needs access. If need be, re-run this command to add each client IP address that needs access:

sudo ufw allow from client_ip_address to any port 5432

To double-check the rule, we can run ufw status again:

sudo ufw status

Output
To                         Action      From
--                         ------      ----
OpenSSH                    ALLOW       Anywhere
5432                       ALLOW       client_ip_address
OpenSSH (v6)               ALLOW       Anywhere (v6)

With this firewall rule in place, we'll now configure PostgreSQL to listen on its public IP address. This requires a combination of two settings, an entry for the connecting host in pg_hba.conf and configuration of the listen_addresses in postgresql.conf.

Configuring the Allowed Hosts
We'll start by adding the host entry in pg_hba.conf. If you have a different version of PostgreSQL installed, be sure to substitute it in the path below:

sudo nano /etc/postgresql/9.5/main/pg_hba.conf

We'll place the host lines under the comment block that describes how to allow non-local connections. We'll also include a line with the public address of the database server so we can quickly test that our firewall is configured correctly. Be sure to substitute the hostname or IP address of your machines in the example below.


Excerpt from pg_hba.conf
# If you want to allow non-local connections, you need to add more
# "host" records. In that case you will also need to make PostgreSQL
# listen on a non-local interface via the listen_addresses
# configuration parameter, or via the -i or -h command line switches.
host
peterdb peterclient_ip_address/32 md5
Before we save our changes, let's focus on each of the values in this line in case you want to change some of the options:

  • host The first parameter, host, establishes that a TCP/IP connection will be used.
  • database peterdb The second column indicates which database/s the host can connect to. More than one database can be added by separating the names with commas.
  • user peter indicates the user that is allowed to make the connection. As with the database column, multiple users can be specified, separated by commas.
  • address The address specifies the client machine address or addresses and may contain a hostname, IP address range or other special key words. In the example above, we've allowed just the single IP address of our client.
  • auth-method Finally, the auth-method, md5 indicates a double-MD5-hashed password will be supplied for authentication. You'll need to do nothing more than supply the password that was created for the user connecting.
Once you're done, save and exit the file.

Configuring the Listening Address
Next we'll set the listen address in the postgresql.conf file:

sudo nano /etc/postgresql/9.5/main/postgresql.conf

Find the listen_addresses line and below it, define your listen addresses, being sure to substitute the hostname or IP address of your database host. You may want to double-check that you're using the public IP of the database server, not the connecting client:

postgresql.conf
#listen_addresses = 'localhost'         # what IP address(es) to listen on;
listen_addresses = 'localhost,server_ip_address
When you're done save and exit the file.

Restarting PostgreSQL

Our configuration changes won't take effect until we restart the PostgreSQL daemon, so we'll do that before we test:

sudo systemctl restart postgresql

Since systemctl doesn't provide feedback, we'll check the status to make sure the daemon restarted successfully:

sudo systemctl status postgresql

If the output contains "Active: active" and ends with something like the following, then the PostgreSQL daemon is running.

Output
...
Jan 22 19:02:20 PostgreSQL systemd[1]: Started PostgreSQL RDBMS.

Now that we've restarted the daemon, we're ready to test.

Testing From Ubuntu Client Machine
Finally, let's test that we can connect from our client machine. To do this, we'll use psql with -U to specify the user, -h to specify the client's IP address, and -d to specify the database, since we've tightened our security so that the peter can only connect to a single database.

psql -U peter -h postgres_host_ip -d peterdb

If everything is configured correctly, you should receive the following prompt:

Output
Password for user peter:

Enter the password you set earlier when you added the user peter in the PostgreSQL monitor.

If you arrive at the following prompt, you're successfully connected:

[secondary_label]
peterdb=>

This confirms that we can get through the firewall and connect to the database. We'll exit now:

peterdb=# \q

Since we've confirmed our configuration, we'll finish by cleaning up.

Removing the Test Database and User
Back on the host once we've finished testing the connection, we can use the following commands to delete the database and the user as well.

sudo -i -u postgres psql

To delete the database:

postgres=# DROP DATABASE peterdb;

The action is confirmed by the following output:

Output
DROP DATABASE

To delete the user:

postgres=# DROP USER peter;

The success is confirmed by:

Output
DROP ROLE

We’ll finish our cleanup by removing the host entry for the peterdb database from pg_hba.conf file since we no longer need it:

sudo nano /etc/postgresql/9.5/main/pg_hba.conf

Line to remove from `pg_hba.conf`

host  peterdb  peter client_ip_address/32   md5

For the change to take effect, we’ll save and exit, then restart the database server:

sudo systemctl restart postgresl

To be sure it restarted successfully, we’ll check the status:

sudo systemctl status postgres

If we see “Active: active” we’ll know the restart succeeded.

At this point, we can move forward with configuring the application or service on the client that needs to connect remotely.

Conclusion
We've taken essential steps to prevent advertising our PostgreSQL installation by configuring the server's firewall to allow connections only from hosts that require access and by configuring PostgreSQL to accept connections only from those hosts. This mitigates the risk of certain kinds of attacks.

How To Monitor Your Linux Servers with Sysdig

$
0
0

Sysdig is open source, system-level exploration: capture system state and activity from a running Linux instance, then save, filter and analyze. Sysdig is scriptable in Lua and includes a command line interface and a powerful interactive UI, csysdig, that runs in your terminal.


This article will guide you through the steps to install and configure Sysdig to monitor an Ubuntu 16.04 server as an example using Sysdig.

Installing Sysdig Using the Official Script
There's a Sysdig package in the Ubuntu repository, but it's usually a revision or two behind the current version. At the time of publication, for example, installing Sysdig using Ubuntu's package manager will get you Sysdig 0.8.0. However, you can install it using an official script from the project's development page, which is the recommended method of installation. This is the method we'll use.

But first, update the package database to ensure you have the latest list of available packages:

sudo apt-get update

Now download Sysdig's installation script with curl using the following command:

curl https://s3.amazonaws.com/download.draios.com/stable/install-sysdig -o install-sysdig

This downloads the installation script to the file install-sysdig to the current folder. You'll need to execute this script with elevated privileges, and it's dangerous to run scripts you download from the Internet. Before you execute the script, audit its content by opening it in a text editor or by using the less command to display the contents on the screen:

less ./install-sysdig

Once you're comfortable with the commands the script will run, execute the script with the following command:

cat ./install-sysdig | sudo bash

The command will install all dependencies, including kernel headers and modules. The output of the installation will be similar to the following:


Output

* Detecting operating system
* Installing Sysdig public key
OK
* Installing sysdig repository
* Installing kernel headers
* Installing sysdig

...

sysdig-probe:
Running module version sanity check.
- Original module
- No original module exists within this kernel
- Installation
- Installing to /lib/modules/4.4.0-59-generic/updates/dkms/

depmod....

DKMS: install completed.
Processing triggers for libc-bin (2.23-0ubuntu5) ...
Now that you've got Sysdig installed, let's look at some ways to use it.

Monitoring Your System in Real-Time
In this section, you'll use the sysdig command to look at some events on your Ubuntu 16.04 server. The sysdig command requires root privileges to run, and it takes any number of options and filters. The simplest way to run the command is without any arguments. This will give you a real-time view of system data refreshed every two seconds:

sudo sysdig

But, as you'll see as soon as you run the command, it can be difficult to analyze the data being written to the screen because it streams continuously, and there are lots of events happening on your server. Stop sysdig by pressing CTRL+C.

Before we run the command again with some options, let's get familiar with the output by looking at a sample output from the command:


Output

253566 11:16:42.808339958 0 sshd (12392) > rt_sigprocmask
253567 11:16:42.808340777 0 sshd (12392) < rt_sigprocmask
253568 11:16:42.808341072 0 sshd (12392) > rt_sigprocmask
253569 11:16:42.808341377 0 sshd (12392) < rt_sigprocmask
253570 11:16:42.808342432 0 sshd (12392) > clock_gettime
253571 11:16:42.808343127 0 sshd (12392) < clock_gettime
253572 11:16:42.808344269 0 sshd (12392) > read fd=10(/dev/ptmx) size=16384
253573 11:16:42.808346955 0 sshd (12392) < read res=2 data=..
The output's columns are:


Output

%evt.num %evt.outputtime %evt.cpu %proc.name (%thread.tid) %evt.dir %evt.type %evt.info
Here's what each column means:
  • evt.num is the incremental event number.
  • evt.outputtime is the event timestamp, which you can customize.
  • evt.cpu is the CPU number where the event was captured. In the above output, the evt.cpu is 0, which is the server's first CPU.
  • proc.name is the name of the process that generated the event.
  • thread.tid is the TID that generated the event, which corresponds to the PID for single thread processes.
  • evt.dir is the event direction. You'll see > for enter events and < for exit events.
  • evt.type is the name of the event, e.g. 'open', 'read', 'write', etc.
  • evt.info is the list of event arguments. In case of system calls, these tend to correspond to the system call arguments, but that’s not always the case: some system call arguments are excluded for simplicity or performance reasons.
There's hardly any value in running sysdig like you did in the previous command because there's so much information streaming in. But you can apply options and filters to the command using this syntax:

sudo sysdig [option] [filter]

You can view the complete list of available filters using:

sysdig -l

There's an extensive list of filters spanning several classes, or categories. Here are some of the classes:
  • fd: Filter on file descriptor (FD) information, like FD numbers and FD names.
  • process: Filter on process information, like id and name of the process that generated an event.
  • evt: Filter on event information, like event number and time.
  • user: Filter on user information, like user id, username, user's home directory or login shell.
  • group: Filter on group information, like group id and name.
  • syslog: Filter on syslog information, like facility and severity.
  • fdlist: Filter on file descriptor for poll events.
Since it's not practical to cover every filter in this tutorial, let's just try a couple, starting with the syslog.severity.str filter in the syslog class, which lets you view messages sent to syslog at a specific severity level. This command shows messages sent to syslog at the "information" level:

sudo sysdig syslog.severity.str=info

Kill the command by pressing CTRL+C.

The output, which should be fairly easy to interpret, should look something like this:


Output

10716 03:15:37.111266382 0 sudo (26322) < sendto syslog sev=info msg=Jan 24 03:15:37 sudo: pam_unix(sudo:session): session opened for user root b
618099 03:15:57.643458223 0 sudo (26322) < sendto syslog sev=info msg=Jan 24 03:15:57 sudo: pam_unix(sudo:session): session closed for user root
627648 03:16:23.212054906 0 sudo (27039) < sendto syslog sev=info msg=Jan 24 03:16:23 sudo: pam_unix(sudo:session): session opened for user root b
629992 03:16:23.248012987 0 sudo (27039) < sendto syslog sev=info msg=Jan 24 03:16:23 sudo: pam_unix(sudo:session): session closed for user root
639224 03:17:01.614343568 0 cron (27042) < sendto syslog sev=info msg=Jan 24 03:17:01 CRON[27042]: pam_unix(cron:session): session opened for user
639530 03:17:01.615731821 0 cron (27043) < sendto syslog sev=info msg=Jan 24 03:17:01 CRON[27043]: (root) CMD ( cd / && run-parts --report /etc/
640031 03:17:01.619412864 0 cron (27042) < sendto syslog sev=info msg=Jan 24 03:17:01 CRON[27042]: pam_unix(cron:session): session closed for user
You can also filter on a single process. For example, to look for events from nano, execute this command:

sudo sysdig proc.name=nano

Since this command filers on nano, you will have to use the nano text editor to open a file to see any output. Open another terminal editor, connect to your server, and use nano to open a text file. Write a few characters and save the file. Then return to your original terminal.

You'll then see some output similar to this:


Output

21840 11:26:33.390634648 0 nano (27291) < mmap res=7F517150A000 vm_size=8884 vm_rss=436 vm_swap=0
21841 11:26:33.390654669 0 nano (27291) > close fd=3(/lib/x86_64-linux-gnu/libc.so.6)
21842 11:26:33.390657136 0 nano (27291) < close res=0
21843 11:26:33.390682336 0 nano (27291) > access mode=0(F_OK)
21844 11:26:33.390690897 0 nano (27291) < access res=-2(ENOENT) name=/etc/ld.so.nohwcap
21845 11:26:33.390695494 0 nano (27291) > open
21846 11:26:33.390708360 0 nano (27291) < open fd=3(/lib/x86_64-linux-gnu/libdl.so.2) name=/lib/x86_64-linux-gnu/libdl.so.2 flags=4097(O_RDONLY|O_CLOEXEC) mode=0
21847 11:26:33.390710510 0 nano (27291) > read fd=3(/lib/x86_64-linux-gnu/libdl.so.2) size=832
Again, kill the command by typing CTRL+C.

Getting a real time view of system events using sysdig is not always the best method of using it. Luckily, there's another way - capturing events to a file for analysis at a later time. Let's look at how.

Capturing System Activity to a File Using Sysdig
Capturing system events to a file using sysdig lets you analyze those events at a later time. To save system events to a file, pass sysdig the -w option and specify a target file name, like this:

sudo sysdig -w sysdig-trace-file.scap

Sysdig will keep saving generated events to the target file until you press CTRL+C. With time, that file can grow quite large. With the -n option, however, you can specify how many events you want Sysdig to capture. After the target number of events have been captured, it will exit. For example, to save 300 events to a file, type:

sudo sysdig -n 300 -w sysdig-file.scap

Though you can use Sysdig to capture a specified number of events to a file, a better approach would be to use the -C option to break up a capture into smaller files of a specific size. And to not overwhelm the local storage, you can instruct Sysdig to keep only a few of the saved files. In other words, Sysdig supports capturing events to logs with file rotation, in one command.

For example, to save events continuously to files that are no more than 1 MB in size, and only keep the last five files (that's what the -W option does), execute this command:

sudo sysdig -C 1 -W 5 -w sysdig-trace.scap

List the files using ls -l sysdig-trace* and you'll see output similar to this, with five log files:


Output

-rw-r--r-- 1 root root 985K Nov 23 04:13 sysdig-trace.scap0
-rw-r--r-- 1 root root 952K Nov 23 04:14 sysdig-trace.scap1
-rw-r--r-- 1 root root 985K Nov 23 04:13 sysdig-trace.scap2
-rw-r--r-- 1 root root 985K Nov 23 04:13 sysdig-trace.scap3
-rw-r--r-- 1 root root 985K Nov 23 04:13 sysdig-trace.scap4
As with real-time capture, you can apply filters to saved events. For example, to save 200 events generated by the process nano, type this command:

sudo sysdig -n 200 -w sysdig-trace-nano.scap proc.name=nano

Then, in another terminal connected to your server, open a file with nano and generate some events by typing text or saving the file. The events will be captured to sysdig-trace-nano.scap until sysdig records 200 events.

How would you go about capturing all write events generated on your server? You would apply the filter like this:

sudo sysdig -w sysdig-write-events.scap evt.type=write

Press CTRL+C after a few moments to exit.

You can do a whole lot more when saving system activity to a file using sysdig, but these examples should have given you a pretty good idea of how to go about it. Let's look at how to analyze these files.

Reading and Analyzing Event Data with Sysdig
Reading captured data from a file with Sysdig is as simple as passing the -r switch to the sysdig command, like this:

sudo sysdig -r sysdig-trace-file.scap

That will dump the entire content of the file to the screen, which is not really the best approach, especially if the file is large. Luckily, you can apply the same filters when reading the file that you applied to it while it was being written.

For example, to read the sysdig-trace-nano.scap trace file you created, but only look at a specific type of event, like write events, type this command:

sysdig -r sysdig-trace-nano.scap evt.type=write

The output should be similar to:


Output

21340 13:32:14.577121096 0 nano (27590) < write res=1 data=.
21736 13:32:17.378737309 0 nano (27590) > write fd=1 size=23
21737 13:32:17.378748803 0 nano (27590) < write res=23 data=#This is a test file..#
21752 13:32:17.611797048 0 nano (27590) > write fd=1 size=24
21753 13:32:17.611808865 0 nano (27590) < write res=24 data= This is a test file..#
21768 13:32:17.992495582 0 nano (27590) > write fd=1 size=25
21769 13:32:17.992504622 0 nano (27590) < write res=25 data=TThis is a test file..# T
21848 13:32:18.338497906 0 nano (27590) > write fd=1 size=25
21849 13:32:18.338506469 0 nano (27590) < write res=25 data=hThis is a test file..[5G
21864 13:32:18.500692107 0 nano (27590) > write fd=1 size=25
21865 13:32:18.500714395 0 nano (27590) < write res=25 data=iThis is a test file..[6G
21880 13:32:18.529249448 0 nano (27590) > write fd=1 size=25
21881 13:32:18.529258664 0 nano (27590) < write res=25 data=sThis is a test file..[7G
21896 13:32:18.620305802 0 nano (27590) > write fd=1 size=25
Let's look at the contents of the file you saved in the previous section: the sysdig-write-events.scap file. We know that all events saved to the file are write events, so let's view the contents:

sudo sysdig -r sysdig-write-events.scap evt.type=write

This is a partial output. You will see something like this if there was any SSH activity on the server when you captured the events:


Output

42585 19:58:03.040970004 0 gmain (14818) < write res=8 data=........
42650 19:58:04.279052747 0 sshd (22863) > write fd=3(<4t>11.11.11.11:43566->22.22.22.22:ssh) size=28
42651 19:58:04.279128102 0 sshd (22863) < write res=28 data=.8c..jp...P........s.E<...s.
42780 19:58:06.046898181 0 sshd (12392) > write fd=3(<4t>11.11.11.11:51282->22.22.22.22:ssh) size=28
42781 19:58:06.046969936 0 sshd (12392) < write res=28 data=M~......V.....Z...\..o...N..
42974 19:58:09.338168745 0 sshd (22863) > write fd=3(<4t>11.11.11.11:43566->22.22.22.22:ssh) size=28
42975 19:58:09.338221272 0 sshd (22863) < write res=28 data=66..J.._s&U.UL8..A....U.qV.*
43104 19:58:11.101315981 0 sshd (12392) > write fd=3(<4t>11.11.11.11:51282->22.22.22.22:ssh) size=28
43105 19:58:11.101366417 0 sshd (12392) < write res=28 data=d).(...e....l..D.*_e...}..!e
43298 19:58:14.395655322 0 sshd (22863) > write fd=3(<4t>11.11.11.11:43566->22.22.22.22:ssh) size=28
43299 19:58:14.395701578 0 sshd (22863) < write res=28 data=.|.o....\...V...2.$_...{3.3|
43428 19:58:16.160703443 0 sshd (12392) > write fd=3(<4t>11.11.11.11:51282->22.22.22.22:ssh) size=28
43429 19:58:16.160788675 0 sshd (12392) < write res=28 data=..Hf.%.Y.,.s...q...=..(.1De.
43622 19:58:19.451623249 0 sshd (22863) > write fd=3(<4t>11.11.11.11:43566->22.22.22.22:ssh) size=28
43623 19:58:19.451689929 0 sshd (22863) < write res=28 data=.ZT^U.pN....Q.z.!.i-Kp.o.y..
43752 19:58:21.216882561 0 sshd (12392) > write fd=3(<4t>11.11.11.11:51282->22.22.22.22:ssh) size=28
4t>4t>4t>4t>4t>4t>4t>4t>
Notice that all the lines in the preceding output contain 11.11.11.11:51282->22.22.22.22:ssh. Those are events coming from the external IP address of the client, 11.11.11.11 to the IP address of the server, 22.22.22.22 . These events occurred over an SSH connection to the server, so those events are expected. But are there other SSH write events that are not from this known client IP address? It's easy to find out.

There are many comparison operators you can use with Sysdig. The first one you saw is =. Others are !=, >, >=, <, and <=. In the following command, fd.rip filters on remote IP address. We'll use the != comparison operator to look for events that are from IP addresses other than 11.11.11.11:

sysdig -r sysdig-write-events.scap fd.rip!=11.11.11.11

A partial output, which showed that there were write events from IP addresses other than the client IP address, is shown in the following output:


Output

294479 21:47:47.812314954 0 sshd (28766) > read fd=3(<4t>33.33.33.33:49802->22.22.22.22:ssh) size=1
294480 21:47:47.812315804 0 sshd (28766) < read res=1 data=T
294481 21:47:47.812316247 0 sshd (28766) > read fd=3(<4t>33.33.33.33:49802->22.22.22.22:ssh) size=1
294482 21:47:47.812317094 0 sshd (28766) < read res=1 data=Y
294483 21:47:47.812317547 0 sshd (28766) > read fd=3(<4t>33.33.33.33:49802->22.22.22.22:ssh) size=1
294484 21:47:47.812318401 0 sshd (28766) < read res=1 data=.
294485 21:47:47.812318901 0 sshd (28766) > read fd=3(<4t>33.33.33.33:49802->22.22.22.22:ssh) size=1
294486 21:47:47.812320884 0 sshd (28766) < read res=1 data=.
294487 21:47:47.812349108 0 sshd (28766) > fcntl fd=3(<4t>33.33.33.33:49802->22.22.22.22:ssh) cmd=4(F_GETFL)
294488 21:47:47.812350355 0 sshd (28766) < fcntl res=2(/dev/null)
294489 21:47:47.812351048 0 sshd (28766) > fcntl fd=3(<4t>33.33.33.33:49802->22.22.22.22:ssh) cmd=5(F_SETFL)
294490 21:47:47.812351918 0 sshd (28766) < fcntl res=0(/dev/null)
294554 21:47:47.813383844 0 sshd (28767) > write fd=3(<4t>33.33.33.33:49802->22.22.22.22:ssh) size=976
294555 21:47:47.813395154 0 sshd (28767) < write res=976 data=........zt.....L.....}....curve25519-sha256@libssh.org,ecdh-sha2-nistp256,ecdh-s
294691 21:47:48.039025654 0 sshd (28767) > read fd=3(<4t>221.229.172.117:49802->45.55.71.190:ssh) size=8192
4t>4t>
4t>
4t>4t>4t>4t>4t>
Further investigation also showed that the rogue IP address 33.33.33.33 belonged to a machine in China. That's something to worry about! That's just one example of how you can use Sysdig to keep a watchful eye on traffic hitting your server.

Let's look at using some additional scripts to analyze the event stream.

Using Sysdig Chisels for System Monitoring and Analysis
In Sysdig parlance, chisels are Lua scripts you can use that analyze the Sysdig event stream to perform useful actions. There are close to 50 scripts that ship with every Sysdig installation, and you can view a list of available chisels on your system using this command:

sysdig -cl

Some of the more interesting chisels include:
  • netstat: List (and optionally filter) network connections.
  • shellshock_detect: Print shellshock attacks
  • spy_users: Display interactive user activity.
  • listloginshells: List the login shell IDs.
  • spy_ip: Show the data exchanged with the given IP address.
  • spy_port: Show the data exchanged using the given IP port number.
  • spy_file: Echo any read or write made by any process to all files. Optionally, you can provide the name of a file to only intercept reads or writes to that file.
  • httptop: Show the top HTTP requests
For a more detailed description of a chisel, including any associated arguments, use the -i flag, followed by the name of the chisel. So, for example, to view more information about the netstat chisel, type:

sysdig -i netstat

Now that you know all you need to know about using that netstat chisel, tap into its power to monitor your system by running:

sudo sysdig -c netstat

The output should be similar to the following:


Output

Proto Server Address Client Address State TID/PID/Program Name
tcp 22.22.22.22:22 11.11.11.11:60422 ESTABLISHED 15567/15567/sshd
tcp 0.0.0.0:22 0.0.0.0:* LISTEN 1613/1613/sshd
If you see ESTABLISHED SSH connections from an IP address other than yours in the Client Address column, that should be a red flag, and you should probe deeper.

A far more interesting chisel is spy_users, which lets you view interactive user activity on the system.

Exit this command:

sudo sysdig -c spy_users

Then, open a second terminal and connect to your server. Execute some commands in that second terminal, then return to your terminal running sysdig. The commands you typed in the first terminal will be echoed on the terminal that you executed the sysdig -c spy_users command on.

Next, let's explore Csysdig, a graphical tool.

Using Csysdig for System Monitoring and Analysis
Csysdig is the other utility that comes with Sysdig. It has an interactive user interface that offers the same features available on the command line with sysdig. It's like top, htop and strace, but more feature-rich.

Like the sysdig command, the csysdig command can perform live monitoring and can capture events to a file for later analysis. But csysdig gives you a more useful real time view of system data refreshed every two seconds. To see an example of that, type the following command:

sudo csysdig

That will open an interface like the one in the following figure, which shows event data generated by all users and applications on the monitored host.


At the bottom of the interface are several buttons you can use to access the different aspects of the program. Most notable is the Views button, which is akin to categories of metrics collected by csysdig. There are 29 views available out of the box, including ProcessesSystem CallsThreadsContainersProcesses CPUPage FaultsFiles, and Directories.
When you start csysdig without arguments, you'll see live events from the Processes view. By clicking on the Views button, or pressing the F2 key, you'll see the list of available views, including a description of the columns. You may also view a description of the columns by pressing the F7 key or by clicking the Legend button. And a summary man page of the application itself (csysdig) is accessible by pressing the F1 key or clicking on the Help button.
The following image shows a listing of the application's Views interface. 


Though you can run csysdig without any options and arguments, the command's syntax, as with sysdig's, usually takes this form:

sudo csysdig [option]...  [filter]

The most common option is -d, which is used to modify the delay between updates in milliseconds. For example, to view csysdig output updated every 10 seconds, instead of the default of 2 seconds, type:

sudo csysdig -d 10000

You can exclude the user and group information from views with the -E option:

sudo csysdig -E

This can make csysdig start up faster, but the speed gain is negligible in most situations.

To instruct csysdig to stop capturing after a certain number of events, use the -n option. The application will exit after that number has been reached. The number of captured events has to be in the five figures; otherwise you won't even see the csysdig UI:

sudo csysdig -n 100000

To analyze a trace file, pass csysdig the -r option, like so:

sudo csysdig -r sysdig-trace-file.scap

You can use the same filters you used with sysdig to restrict csysdig's output. So, for example, rather than viewing event data generated by all users on the system, you can filter the output by users by launching csysdig with the following command, which will show event data only generated by the root user:

sudo csysdig user.name=root

The output should be similar to the one shown in the following image, although the output will reflect what's running on your server:


To view the output for an executable generating an event, pass the filter the name of the binary without the path. The following example will show all events generated by the nano command. In other words, it will show all open files where the text editor is nano:

sudo csysdig proc.name=nano

There are several dozen filters available, which you can view with the following command:

sudo csysdig -l

You'll notice that that was the same option you used to view the filters available with sysdig command. So sysdig and csysdig are just about the same. The main difference is that csysdig comes with a mouse-friendly interactive UI. To exit csysdig at any time, press the Q key on your keyboard.


Conclusion
Sysdig helps you monitor and troubleshoot your server. It will give you a deep insight into all the system activity on a monitored host, including those generated by application containers. More information is available on the project's home page.

Installing Apache Cassandra on Red Hat Enterprise Linux 6

$
0
0

The Apache Cassandra database is the right choice when you need scalability and high availability without compromising performance. Linear scalability and proven fault-tolerance on commodity hardware or cloud infrastructure make it the perfect platform for mission-critical data.Cassandra's support for replicating across multiple datacenters is best-in-class, providing lower latency for your users and the peace of mind of knowing that you can survive regional outages.


What is Cassandra?
Cassandra is a NoSQL database technology. NoSQL is referred as not only SQL and it means an alternative to traditional relational database technologies like MySQL, Oracle, MSSQL. Apache cassandra is a distributed database. With cassandra database do not lives only on one server but is spread across multiple servers. This allows database to grow almost infinitely as it is no longer dependent on specifications of one server.

It is a big data technology which provides massive scalability.

Why Use Cassandra?
The top features that makes Cassandra pretty comprehensive and more powerful can be summarized as below:

PROVEN - Cassandra is in use at Constant Contact, CERN, Comcast, eBay, GitHub, GoDaddy, Hulu, Instagram, Intuit, Netflix, Reddit, The Weather Channel, and over 1500 more companies that have large, active data sets.

FAULT TOLERANT - Data is automatically replicated to multiple nodes for fault-tolerance. Replication across multiple data centers is supported. Failed nodes can be replaced with no downtime.

PERFORMANT - Cassandra consistently outperforms popular NoSQL alternatives in benchmarks and real applications, primarily because of fundamental architectural choices.

DECENTRALIZED - There are no single points of failure. There are no network bottlenecks. Every node in the cluster is identical.

SCALABLE - Some of the largest production deployments include Apple's, with over 75,000 nodes storing over 10 PB of data, Netflix (2,500 nodes, 420 TB, over 1 trillion requests per day), Chinese search engine Easou (270 nodes, 300 TB, over 800 million requests per day), and eBay (over 100 nodes, 250 TB).

DURABLE - Cassandra is suitable for applications that can't afford to lose data, even when an entire data center goes down.

YOU'RE IN CONTROL - Choose between synchronous or asynchronous replication for each update. Highly available asynchronous operations are optimized with features like Hinted Handoff and Read Repair.

ELASTIC - Read and write throughput both increase linearly as new machines are added, with no downtime or interruption to applications.

Cassandra Read/Write Mechanism
Now we will discuss how Cassandra read/write mechanism works. First let's have a look on important components.

Following are the key components of Cassandra.


  • Node– This is the most basic component of cassandra and it is the place where data is stored.
  • Data Center– In simplest term a datacenter is nothing but a collection of nodes. A datacenter can be a physical datacenter or virtual datacenter.
  • Cluster– Collection of many data centers is termed as cluster.
  • Commit Log– Every write operation is written to Commit Log. Commit log is used for crash recovery. After all its data has been flushed to SSTables, it can be archived, deleted, or recycled.
  • Mem-table– A mem-table is a memory-resident data structure. Data is written in  commit log and mem-table simultaneously. Data stored in mem-tables are temporary and it is flushed to SSTables when mem-tables reaches configured threshold.
  • SSTable– This is the disk file where data is flushed when Mem-table reaches a certain threshold.
  • Bloom filter− These are nothing but quick, nondeterministic, algorithms for testing whether an element is a member of a set. It is a special kind of cache. Bloom filters are accessed after every query.
  • Cassandra Keyspace– Keyspace is similar to a schema in the RDBMS world. A keyspace is a container for all your application data.
  • CQL Table– A collection of ordered columns fetched by table row. A table consists of columns and has a primary key.

Cassandra Write Operation
Since cassandra is a distributed database technology where data are spread across nodes of the cluster and there is no master-slave relationship between the nodes, it is important to understand how data is stored (written) within the database.

Cassandra processes data at several stages on the write path, starting with the immediate logging of a write and ending in with a write of data to disk:

  • Logging data in the commit log
  • Writing data to the memtable
  • Flushing data from the memtable
  • Storing data on disk in SSTables

When a new piece of data is written, it is written at 2 places i.e Mem-tables and in the commit.log on disk ( for data durability). The commit log receives every write made to a Cassandra node, and these durable writes survive permanently even if power fails on a node.

Mem-tables are nothing but a write-back cache of data partition. Writes in Mem-tables are stored in a sorted manner and when Mem-table reaches the threshold, data is flushed to SSTables.

Flushing data from the Mem-Table
Data from Mem-table is flushed to SSTables in the same order as they were stored in Mem-Table. Data is flushed in following 2 conditions:
  • When the memtable content exceeds the configurable threshold
  • The commit.log space exceeds the commitlog_total_space_in_mb
If any of the condition reaches, cassandra places the memtables in a queue that is flushed to disk. The size of queue can be configured by using options memtable_heap_space_in_mb or memtable_offheap_space_in_mb in cassandra.yaml configuration file. Mem-Table can be manually flushed using command nodetool flush
Data in the commit log is purged after its corresponding data in the memtable is flushed to an SSTable on disk.

Storing data on disk in SSTables 
Memtables and SSTables are maintained per table. The commit log is shared among tables. Memtable is flushed to an immutable structure called and SSTable (Sorted String Table).
Every SSTable creates three files on disk
  1. Data (Data.db) – The SSTable data
  2. Primary Index (Index.db) – Index of the row keys with pointers to their positions in the data file
  3. Bloom filter (Filter.db) – A structure stored in memory that checks if row data exists in the memtable before accessing SSTables on disk
Over a period of time a number of SSTables are created. This results in the need to read multiple SSTables to satisfy a read request.  Compaction is the process of combining SSTables so that related data can be found in a single SSTable. This helps with making reads much faster.
The commit log is used for playback purposes in case data from the memtable is lost due to node failure. For example the node has a power outage or someone accidently shut it down before the memtable could get flushed.


Read Operation
Cassandra processes data at several stages on the read path to discover where the data is stored, starting with the data in the memtable and finishing with SSTables:
  • Check the memtable
  • Check row cache, if enabled
  • Checks Bloom filter
  • Checks partition key cache, if enabled
  • Goes directly to the compression offset map if a partition key is found in the partition key cache, or checks the partition summary if not.
  • If the partition summary is checked, then the partition index is accessed
  • Locates the data on disk using the compression offset map
  • Fetches the data from the SSTable on disk


There are three types of read requests that a coordinator sends to replicas.
  1. Direct request
  2. Digest request
  3. Read repair request
The coordinator sends direct request to one of the replicas. After that, the coordinator sends the digest request to the number of replicas specified by the consistency level and checks whether the returned data is an updated data.
After that, the coordinator sends digest request to all the remaining replicas. If any node gives out of date value, a background read repair request will update that data. This process is called read repair mechanism.

Installing Cassandra on Red Hat Enterprise Linux 6
Before we start with installation, let's discuss few concepts first which will help you to understand installation process.
BootstrappingBootstrapping is the process in which a newly-joining node gets the required data from the neighbors in the ring, so it can join the ring with the required data. Typically, a bootstrapping node joins the ring without any state or token and understands the ring structure after starting the gossip with the seed nodes; the second step is to choose a token to bootstrap.
During the bootstrap, the bootstrapping node will receive writes for the range that it will be responsible for after the bootstrap is completed. This additional write is done to ensure that the node doesn’t miss any new data during the bootstrap from the point when we requested the streaming to the point at which the node comes online.
Seed NodesThe seed node designation has no purpose other than bootstrapping the gossip process for new nodes joining the cluster. Seed nodes are not a single point of failure, nor do they have any other special purpose in cluster operations beyond the bootstrapping of nodes.
In cluster formation, nodes see each other and “join”. They do not join just any node which respects the protocol, however. This would be risky: old partitioned replicas, different clusters, even malicious nodes, so on. So a cluster is defined by some initial nodes which are available at clear addresses and they become a reference for that cluster for any new nodes to join in trustable way. The seed nodes can go away after some time, the cluster will keep on.

Prerequisites

  • Static IP Address on all 4 nodes and make sure all 4 nodes are reachable to each other via hostname/IP.
  • hostname should have been defined in /etc/sysconfig/network file.
  • Update /etc/hosts file accordingly

Since we are working in lab environment, following credentials will be used through out this guide and we will set up Cassandra nodes in /etc/hosts file as below. You can update /etc/hosts file by executing the following command on each node.

vi /etc/hosts

192.168.109.70cassdb01#SEED-node
192.168.109.71cassdb02#Worker-node1
192.168.109.72cassdb03#Worker-node2
192.168.109.73cassdb04#Worker-node3

Save and exit

Open Firewall Ports
You need to allow access on 7000 and 9160 ports of Cassandra if you are using iptables with the following command on each node.

iptables -A INPUT -p tcp –dport 7000 -j ACCEPT
iptables -A INPUT -p tcp –dport 9160 -j ACCEPT

Create Cassandra user with sudo permissions.
You can download and use following script to create a user on server with sudo permissions.

The following steps will be performed on cassdb01 node.

wget https://raw.githubusercontent.com/zubayr/create_user_script/master/create_user_script.sh
chmod 777 create_user_script.sh
sh create_user_script.sh -s cassandra

When you are done with above commands, make sure cassandra user/group is created on server with the following command.

cat /etc/passwd | grep cassandra

Output
cassandra:x:501:501::/home/cassandra:/bin/bash

cat /etc/group | grep cassandra

Output
cassandra:x:501:

Installing Java
We need to install oracle java (jdk or jre) version 7 or greater and defined JAVA_HOME accordingly. You can install java with rpm based installer or using tar file.

Cassandra 3.0 and later require Java 8u40 or later. I'll be installing rpm package.

rpm -Uvh jdk-8u111-linux-x64.rpm

Note: If you have openjdk installed on your system then please remove it before installing oracle java.

Verify that JAVA_HOME is set correctly and you are getting an output similar to below and an output for java -version command

cat .bash_profile | grep JAVA_HOME

Output
JAVA_HOME=/usr/java/jdk1.8.0_111
PATH=$PATH:$HOME/bin/:$JAVA_HOME/bin:$CASSANDRA_HOME/bin
export PATH JAVA_HOME CASSANDRA_HOME

java -version

Output
java version “1.8.0_111”
Java(TM) SE Runtime Environment (build 1.8.0_111-b14)
Java HotSpot(TM) 64-Bit Server VM (build 25.111-b14, mixed mode)

Install and Configure Cassandra
Latest Cassandra version can be found from cassandra Home Page. Download and extract apache-cassandra tar.gz file in a directory of your choice. I used /opt as destination directory.

tar -zxvf apache-cassandra-3.9-bin.tar.gz
ln -s /opt/apache-cassandra-3.9 /opt/apache-cassandra
chown cassandra:cassandra -R /opt/apache-cassandra
chown cassandra:cassandra -R /opt/apache-cassandra-3.9

Now, create necessary directories (for cassandra to store data)  and assign permissions on those directories.

mkdir /var/lib/cassandra/data
mkdir /var/log/cassandra
mkdir /var/lib/cassandra/commitlog
chown -R cassandra:cassandra /var/lib/cassandra/data
chown -R cassandra:cassandra /var/log/cassandra/
chown -R cassandra:cassandra /var/lib/cassandra/commitlog

Start the Cassandra service by executing the following command

$CASSANDRA_HOME/bin/cassandra -f -R

You will see below messages on command prompt which shows that cassandra have been started without any issues.

Output
INFO 11:31:15 Starting listening for CQL clients on localhost/127.0.0.1:9042 (unencrypted)…
INFO 11:31:15 Not starting RPC server as requested. Use JMX (StorageService->startRPCServer()) or nodetool (enablethrift) to start it
INFO 11:31:24 Scheduling approximate time-check task with a precision of 10 milliseconds
INFO 11:31:25 Created default superuser role ‘cassandra’

If you want to start cassandra as a service, you can use this script from github. Change value of following variable as per your environment.

CASS_HOME=/opt/apache-cassandra
CASS_BIN=$CASS_HOME/bin/cassandra
CASS_LOG=/var/log/cassandra/system.log
CASS_USER="root"
CASS_PID=/var/run/cassandra.pid

Save the file in /etc/init.d directory.

Now execute the following commands to add cassandra as a service

chmod +x /etc/init.d/cassandra
chkconfig –add cassandra
chkconfig cassandra on

Start cassandra service and verify its status by checking the system.log file

service cassandra status

Output
Cassandra is running.

System.log file contains the following info on my system and it means all well.

INFO  12:45:50 Node localhost/127.0.0.1 state jump to NORMAL

You can also verify using Nodetool and its output says node as UP and Normal
$CASSANDRA_HOME/bin/nodetool status

Output
Datacenter: datacenter1
=======================
Status=Up/Down
|/ State=Normal/Leaving/Joining/Moving
— Address Load Tokens Owns (effective) Host ID Rack
UN 127.0.0.1 168.62 KiB 256 100.0% 14ba62c6-59e4-404b-a6a6-30c9503ef3a4 rack1


Adding Node To Cassandra Cluster
Before we start installing apache cassandra on remaining nodes, We need to perform following configuration changes in cassandra.yaml file.

Navigate to cassandra.yaml file which is located under cassandra_install_dir/conf folder. Open the file in editor of your choice and look for following options:

  • Listen_address: Address where gossip will be listening to. This address can’t be localhost or 0.0.0.0, because the rest of nodes will try to connect to this address.
  • RPC_address: This is the address where thrift will be listening. We must put a existing IP address (it may be localhost, if we want to), or 0.0.0.0 if we want to listen through all of them. This is the address to which client applications interact with cassandra DB.
  • Seeds: Seed nodes are the nodes which will provide cluster info to the new nodes which are bootstrapped and are ready to join the cluster. Seed nodes become a reference for any new nodes to join cluster in trustable way.

The above settings need to be configured in cassandra.yaml file on each node which we want to put into the cluster.

Note: You must install the same version of Cassandra on the remaining nodes in the cluster.

Adding new nodes in Cassandra cluster

  1. Install Cassandra on the new nodes, but do not start Cassandra service.
  2. Set the following properties in the cassandra.yaml file and, depending on the snitch, the cassandra-topology.properties or cassandra-rackdc.properties configuration files:


auto_bootstrap– This property is not listed in the default cassandra.yaml configuration file, but it might have been added and set to false by other operations. If it is not defined in cassandra.yaml, Cassandra uses true as a default value. For this operation, search for this property in the cassandra.yaml file. If it is present, set it to true or delete it..
cluster_name– The name of the cluster the new node is joining. Ensure that cluster name is same for all nodes which will be part of cluster.
listen_address– Can usually be left blank. Otherwise, use IP address or hostname that other Cassandra nodes use to connect to the new node.
endpoint_snitch– The snitch Cassandra uses for locating nodes and routing requests. In my lab I am using simple snitch which is present as default in cassandra.yaml file and so I did not change or edit this.
num_tokens– The number of vnodes to assign to the node. If the hardware capabilities vary among the nodes in your cluster, you can assign a proportional number of vnodes to the larger machines.
seeds– Determines which nodes the new node contacts to learn about the cluster and establish the gossip process. Make sure that the -seeds list includes the address of at least one node in the existing cluster.

Installation and configuration changes steps will be remain same as we have already performed in above on Node 1. Once you are done installing cassandra and making the configuration changes as mentioned above on your second node, you can start cassandra service on second node and look into nodetool status on cassandra node 1 and you will observe the new node joining the cluster.

Nodetool Status Output
You can see in below output that our second node has been added to cluster and its up and running.

Every 2.0s: /opt/apache-cassandra/bin/nodetool status Thru 20 23:31:44 2016
Datacenter: datacenter1
=======================
Status=Up/Down
|/ State=Normal/Leaving/Joining/Moving
— Address               Load           Tokens Owns (effective) Host ID Rack
UN 192.168.109.70 214.99 KiB  256           100.0%       14ba62c6-59e4-404b-a6a6-30c9503ef3a4       rack1
UN 192.168.109.71 103.47 KiB  256      100.0%    3b19bc83-f483-4a60-82e4-109c90c49a14      rack1


You need to repeat the same steps for each node which you want to add in Cassandra cluster.

How Nodetool Works?
We will explain nodetool and see how we can manage a cassandra cluster using nodetool utility.

The nodetool utility is a command line interface for managing a cluster. It provides a simple command line interface to expose operations and attributes available with cassandra. There are hundreds of options available with nodetool utility but we will cover only those which are being used more often.

Nodetool version: This provides the version of Cassandra running on the specified node.

[root@cassdb01 ~]# nodetool version
ReleaseVersion: 3.9

Nodetool status: This is one of the most common command which you will be using in a cassandra cluster. It provide information about the cluster, such as the state, load, and IDs. It will aslo tell you the name of datacenter where your nodes are lying and what is their state.

State ‘UN’ referes to up and normal. When a new node is added to cluster, you might see the state of node as ‘UJ’ which means node is up and now in process of joining the cluster.

Nodetool status will give you IP address of all of your nodes and also how much percentage load each node is owning. It is not neccsary that each node will own exactly the same percentage of load. For e.g in a 4 node cluster, it is not neccessary that each node owns exactly 25% of total load on cluster. One node might be owning 30% and other may be at 22% or so. But there should not be much difference in % of load being owned by each node.

[root@cassdb04 ~]# nodetool status
Datacenter: datacenter1
=======================
Status=Up/Down
|/ State=Normal/Leaving/Joining/Moving
— Address Load Tokens Owns (effective) Host ID Rack
UN 192.168.109.72 175.92 KiB 256 48.8% 32da4275-0b20-4805-ab3e-2067f3b2b32b rack1
UN 192.168.109.73 124.63 KiB 256 50.0% c04ac5dd-02db-420c-9933-181b99848c4f rack1
UN 192.168.109.70 298.79 KiB 256 50.8% 14ba62c6-59e4-404b-a6a6-30c9503ef3a4 rack1
UN 192.168.109.71 240.57 KiB 256 50.4% 3b19bc83-f483-4a60-82e4-109c90c49a14 rack1

Nodetool info: This returns information about specific node. In output of above command you can see gossip state (whether its active or not), load on node,  rack and datacenter where node is placed.

[root@cassdb04 ~]# nodetool info
ID : c04ac5dd-02db-420c-9933-181b99848c4f
Gossip active : true
Thrift active : false
Native Transport active: true
Load : 124.63 KiB
Generation No : 1484323575
Uptime (seconds) : 1285
Heap Memory (MB) : 65.46 / 1976.00
Off Heap Memory (MB) : 0.00
Data Center : datacenter1
Rack : rack1
Exceptions : 0
Key Cache : entries 11, size 888 bytes, capacity 98 MiB, 323 hits, 370 requests, 0.873 recent hit rate, 14400 save period in seconds
Row Cache : entries 0, size 0 bytes, capacity 0 bytes, 0 hits, 0 requests, NaN recent hit rate, 0 save period in seconds
Counter Cache : entries 0, size 0 bytes, capacity 49 MiB, 0 hits, 0 requests, NaN recent hit rate, 7200 save period in seconds
Chunk Cache : entries 16, size 1 MiB, capacity 462 MiB, 60 misses, 533 requests, 0.887 recent hit rate, 70.149 microseconds miss latency
Percent Repaired : 100.0%
Token : (invoke with -T/–tokens to see all 256 tokens)

Note: To query about information of remote node, you can use -h and -p switch with nodetool info coomand. -h needs ip/fqdn of remote node and -p is the jmx port.

[root@cassdb04 ~]# nodetool -h 192.168.109.70 -p 7199 info
ID : 14ba62c6-59e4-404b-a6a6-30c9503ef3a4
Gossip active : true
Thrift active : false
Native Transport active: true
Load : 198.57 KiB
Generation No : 1484589468
Uptime (seconds) : 165
Heap Memory (MB) : 91.97 / 1986.00
Off Heap Memory (MB) : 0.00
Data Center : datacenter1
Rack : rack1
Exceptions : 0
Key Cache : entries 17, size 1.37 KiB, capacity 99 MiB, 71 hits, 102 requests, 0.696 recent hit rate, 14400 save period in seconds
Row Cache : entries 0, size 0 bytes, capacity 0 bytes, 0 hits, 0 requests, NaN recent hit rate, 0 save period in seconds
Counter Cache : entries 0, size 0 bytes, capacity 49 MiB, 0 hits, 0 requests, NaN recent hit rate, 7200 save period in seconds
Chunk Cache : entries 12, size 768 KiB, capacity 464 MiB, 78 misses, 230 requests, 0.661 recent hit rate, 412.649 microseconds miss latency
Percent Repaired : 100.0%
Token : (invoke with -T/–tokens to see all 256 tokens)

Nodetool describecluster: This command will give you name of the cassandra cluster, default partitioner which is used in cluster, type of snitch being used etc.

[root@cassdb01 ~]# nodetool describecluster
Cluster Information:
Name: Test Cluster
Snitch: org.apache.cassandra.locator.DynamicEndpointSnitch
Partitioner: org.apache.cassandra.dht.Murmur3Partitioner
Schema versions:
86afa796-d883-3932-aa73-6b017cef0d19: [192.168.109.72, 192.168.109.73, 192.168.109.70, 192.168.109.71]

Nodetool ring: This command will tell you which node is responsible for handling which range of tokens. If you are using virtual node concept, each node will be responsible for 256 token ranges. This command will give you a very lengthy output as it will display each and every token associated with each node.

[root@cassdb04 ~]# nodetool ring

Datacenter: datacenter1
==========
Address Rack Status State Load Owns Token
9209474870556602003
192.168.109.70 rack1 Up Normal 240.98 KiB 50.81% -9209386221367757374
192.168.109.73 rack1 Up Normal 124.63 KiB 49.99% -9194836959115518616
192.168.109.73 rack1 Up Normal 124.63 KiB 49.99% -9189566362031437022
192.168.109.71 rack1 Up Normal 240.57 KiB 50.40% -9173836129733051192
192.168.109.71 rack1 Up Normal 240.57 KiB 50.40% -9164925147537642235
192.168.109.71 rack1 Up Normal 240.57 KiB 50.40% -9140745004897827128
192.168.109.72 rack1 Up Normal 175.92 KiB 48.80% -9139635271358393037
192.168.109.73 rack1 Up Normal 124.63 KiB 49.99% -9119385776093381962
192.168.109.73 rack1 Up Normal 124.63 KiB 49.99% -9109674978522278948
192.168.109.72 rack1 Up Normal 175.92 KiB 48.80% -9091325795617772970
192.168.109.71 rack1 Up Normal 240.57 KiB 50.40% -9063930024148859956
192.168.109.71 rack1 Up Normal 240.57 KiB 50.40% -9038394199082806631
192.168.109.72 rack1 Up Normal 175.92 KiB 48.80% -9023437686068220058
192.168.109.73 rack1 Up Normal 124.63 KiB 49.99% -9021385173053652727
192.168.109.71 rack1 Up Normal 240.57 KiB 50.40% -9008429834541495946
192.168.109.70 rack1 Up Normal 240.98 KiB 50.81% -9003901886367509605
192.168.109.73 rack1 Up Normal 124.63 KiB 49.99% -8981251185746444704
192.168.109.72 rack1 Up Normal 175.92 KiB 48.80% -8976243976974462778
192.168.109.72 rack1 Up Normal 175.92 KiB 48.80% -8914749982949440380
192.168.109.71 rack1 Up Normal 240.57 KiB 50.40% -8896728810258422258
192.168.109.72 rack1 Up Normal 175.92 KiB 48.80% -8889132896797497885
192.168.109.73 rack1 Up Normal 124.63 KiB 49.99% -8883470066211443416
192.168.109.72 rack1 Up Normal 175.92 KiB 48.80% -8872886845775707512
192.168.109.72 rack1 Up Normal 175.92 KiB 48.80% -8872853960586482247
192.168.109.72 rack1 Up Normal 175.92 KiB 48.80% -8842804282688091715
192.168.109.71 rack1 Up Normal 240.57 KiB 50.40% -8836328750414937464
192.168.109.70 rack1 Up Normal 240.98 KiB 50.81% -8818194298147545683

Nodetool cleanup: Nodetool cleanup is used to remove that data from a node for which it is not responsible for.

when a node auto bootstraps, it does not remove the data from the node that had previously been responsible for the data. This is so that,if  the new node were to go down shortly after coming online, the data would still exist.

The command to do data cleanup is as below.

[root@cassdb01 ~]# nodetool cleanup
WARN 16:54:29 Small cdc volume detected at /opt/apache-cassandra/data/cdc_raw; setting cdc_total_space_in_mb to 613. You can override this in cassandra.yaml

WARN 16:54:29 Only 52.796GiB free across all data volumes. Consider adding more capacity to your cluster or removing obsolete snapshots

Note: To remove data from a remote node, modify cleanup command as shown below

[root@cassdb01 ~]# nodetool -h 192.168.109.72 cleanup

To see what this command do, you can monitor on nodetool status and you will see load decreasing from that node where cleanup is ran.

Conclusion
We have successfully completed apache cassandra installation on all 4 nodes and added them in cassandra cluster.  I hope this guide will be useful to install and set up your apache cassandra cluster within your production environment.

How To Set Up Apache as a Reverse Proxy on Ubuntu 16.04

$
0
0

A reverse proxy is a type of proxy server that takes HTTP(S) requests and transparently distributes them to one or more backend servers. Reverse proxies are useful because many modern web applications process incoming HTTP requests using backend application servers which aren't meant to be accessed by users directly and often only support rudimentary HTTP features.


You can use a reverse proxy to prevent these underlying application servers from being directly accessed. They can also be used to distribute the load from incoming requests to several different application servers, increasing performance at scale and providing fail-safeness. They can fill in the gaps with features the application servers don't offer, such as caching, compression, or SSL encryption too.

This article will help you to set up Apache as a basic reverse proxy using the mod_proxy extension to redirect incoming connections to one or several backend servers running on the same network. This guide uses a simple backend written with the with Flask web framework, but you can use any backend server you prefer.

Prerequisites


Enabling Necessary Apache Modules
Apache has many modules bundled with it that are available but not enabled in a fresh installation. First, we'll need to enable the ones we'll use in this guide. The modules we need are mod_proxy itself and several of its add-on modules, which extend its functionality to support different network protocols. Specifically, we will use:

  • mod_proxy, the main proxy module Apache module for redirecting connections; it allows Apache to act as a gateway to the underlying application servers.
  • mod_proxy_http, which adds support for proxying HTTP connections.
  • mod_proxy_balancer and mod_lbmethod_byrequests, which add load balancing features for multiple backend servers.


To enable these four modules, execute the following commands in succession.

sudo a2enmod proxy
sudo a2enmod proxy_http
sudo a2enmod proxy_balancer
sudo a2enmod lbmethod_byrequests

To put these changes into effect, restart Apache.

sudo systemctl restart apache2

Apache is now ready to act as a reverse proxy for HTTP requests. In the next (optional) step, we will create two very basic backend servers. These will help us verify if the configuration works properly, but if you already have your own backend application(s), you can skip to Step 3.

Creating Backend Test Servers
Running some simple backend servers is an easy way to test if your Apache configuration is working properly. Here, we'll make two test servers which respond to HTTP requests with printing a line of text. One server will say Hello world! and the other will say Howdy world!.

Note: In non-test setups, backend servers usually all return the same kind of content. However, for this test in particular, having the two servers return different messages makes it easy to check that the load balancing mechanism uses both.

Flask is a Python microframework for building web applications. We're using Flask to create the test servers because a basic app requires just a few lines of code.

Update the packages list first.

sudo apt-get update

Then install Pip, the recommended Python package manager.

sudo apt-get -y install python3-pip

Use Pip to install Flask.

sudo pip3 install flask

Now that all the required components are installed, start by creating a new file that will contain the code for the first backend server in the home directory of the current user.

nano ~/backend1.py

Copy the following code into the file, then save and close it.

from flask import Flask
app = Flask(__name__)

@app.route('/')
def home():
    return 'Hello world!'

The first two lines initialize the Flask framework. There is one function, home(), which returns a line of text (Hello world!). The @app.route('/') line above the home() function definition tells Flask to use home()'s return value as a response to HTTP requests directed at the / root URL of the application.

The second backend server is exactly the same as the first, aside from returning to a different line of text, so start by duplicating the first file.

cp ~/backend1.py ~/backend2.py

Open the newly copied file.

nano ~/backend2.py

Change the message to be returned from Hello world! to Howdy world!, then save and close the file.

from flask import Flask
app = Flask(__name__)

@app.route('/')
def home():
    return 'Howdy world!'

Use the following command to start the first background server on port 8080. This also redirects Flask's output to /dev/null because it would cloud the console output further on.

FLASK_APP=~/backend1.py flask run --port=8080 >/dev/null 2>&1 &

Here, we are preceding the flask command by setting FLASK_APP environment variable in the same line. Environment variables are a convenient way to pass information into processes that are spawned from the shell.

In this case, using an environment variable makes sure the setting applies only to the command being run and will not stay available afterwards, as we will be passing another filename the same way to tell flask command to start the second server

Similarly, use this command to start the second server on port 8081. Note the different value for the FLASK_APP environment variable.

FLASK_APP=~/backend2.py flask run --port=8081 >/dev/null 2>&1 &

You can test that the two servers are running using curl. Test the first server:

curl http://127.0.0.1:8080/

This will output Hello world! in the terminal. Test the second server:

curl http://127.0.0.1:8081/

This will output Howdy world! instead.

Note: To close both test servers after you no longer need them, like when you finish this tutorial, you can simply execute killall flask.

In the next step, we'll modify Apache's configuration file to enable its use as a reverse proxy.

Modifying the Default Configuration to Enable Reverse Proxy
In this section, we will set up the default Apache virtual host to serve as a reverse proxy for single backend server or an array of load balanced backend servers.

Note: In this guide, we're applying the configuration at the virtual host level. On a default installation of Apache, there is only a single, default virtual host enabled. However, you can use all those configuration fragments in other virtual hosts as well.

If your Apache server acts as both HTTP and HTTPS server, your reverse proxy configuration must be placed in both the HTTP and HTTPS virtual hosts.

Open the default Apache configuration file using nano or your favorite text editor.

sudo nano /etc/apache2/sites-available/000-default.conf

Inside that file, you will find the block starting on the first line. The first example below explains how to configure this block to reverse proxy for a single backend server, and the second sets up a load balanced reverse proxy for multiple backend servers.

Example 1 — Reverse Proxying a Single Backend Server

Replace all the contents within VirtualHost block with the following, so your configuration file looks like this:

vi /etc/apache2/sites-available/000-default.conf

    ProxyPreserveHost On

    ProxyPass / http://127.0.0.1:8080/
    ProxyPassReverse / http://127.0.0.1:8080/

If you followed along with the example servers in Step 2, use 127.0.0.1:8080 as written in the block above. If you have your own application servers, use their addresses instead.

There are three directives here:

  • ProxyPreserveHost makes Apache pass the original Host header to the backend server. This is useful, as it makes the backend server aware of the address used to access the application.
  • ProxyPass is the main proxy configuration directive. In this case, it specifies that everything under the root URL (/) should be mapped to the backend server at the given address. For example, if Apache gets a request for /example, it will connect to http://your_backend_server/example and return the response to the original client.
  • ProxyPassReverse should have the same configuration as ProxyPass. It tells Apache to modify the response headers from backend server. This makes sure that if the backend server returns a location redirect header, the client's browser will be redirected to the proxy address and not the backend server address, which would not work as intended.


To put these changes into effect, restart Apache.

sudo systemctl restart apache2

Now, if you access http://your_server_ip in a web browser, you will see your backend server response instead of standard Apache welcome page. If you followed Step 2, this means you'll see Hellow world!.
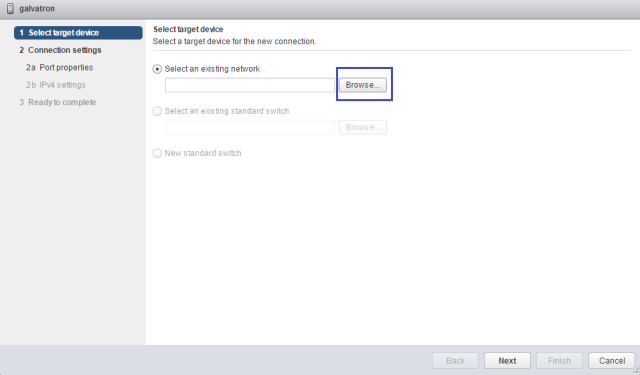
Example 2 — Load Balancing Across Multiple Backend Servers

If you have multiple backend servers, a good way to distribute the traffic across them when proxying is to use load balancing features of mod_proxy.

Replace all the contents within the VirtualHost block with the following, so your configuration file looks like this:

vi /etc/apache2/sites-available/000-default.conf

    BalancerMember http://127.0.0.1:8080
    BalancerMember http://127.0.0.1:8081

    ProxyPreserveHost On

    ProxyPass / balancer://mycluster/
    ProxyPassReverse / balancer://mycluster/

The configuration is similar to the previous one, but instead of specifying a single backend server directly, we've used an additional Proxy block to define multiple servers. The block is named balancer://mycluster (the name can be freely altered) and consists of one or more BalancerMembers, which specify the underlying backend server addresses. The ProxyPass and ProxyPassReverse directives use the load balancer pool named mycluster instead of a specific server.

If you followed along with the example servers in Step 2, use 127.0.0.1:8080 and 127.0.0.1:8081 for the BalancerMember directives, as written in the block above. If you have your own application servers, use their addresses instead.

To put these changes into effect, restart Apache.

sudo systemctl restart apache2

If you access http://your_server_ip in a web browser, you will see your backend servers' responses instead of the standard Apache page. If you followed Step 2, refreshing the page multiple times should show Hello world! and Howdy world!, meaning the reverse proxy worked and is load balancing between both servers.
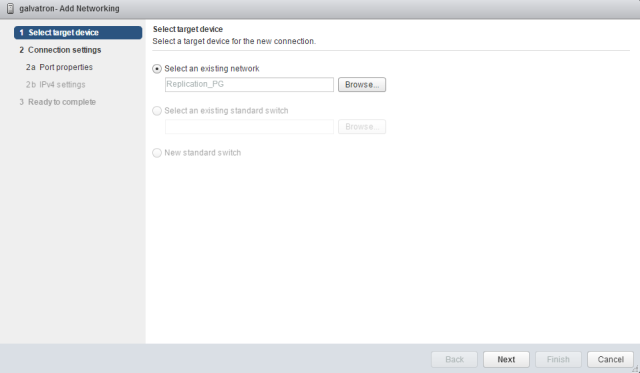


Conclusion
You now know how to set up Apache as a reverse proxy to one or many underlying application servers. mod_proxy can be used effectively to configure reverse proxy to application servers written in a vast array of languages and technologies, such as Python and Django or Ruby and Ruby on Rails. It can be also used to balance traffic between multiple backend servers for sites with lots of traffic or to provide high availability through multiple servers, or to provide secure SSL support to backend servers not supporting SSL natively.

While mod_proxy with mod_proxy_http is the perhaps most commonly used combination of modules, there are several others that support different network protocols. We didn't use them here, but some other popular modules include:

  • mod_proxy_ftp for FTP.
  • mod_proxy_connect for SSL tunneling.
  • mod_proxy_ajp for AJP (Apache JServ Protocol), like Tomcat-based backends.
  • mod_proxy_wstunnel for web sockets.

How To Deploy Skype For Business 2015

$
0
0

This article will guide you through the steps to install and configure Skype for business server 2015. The first step is to download the product, for this guide we will download the evaluation from here. The next step is to install Windows Server 2012 R2 or Windows Server 2012 Standard or Datacenter edition to support Skype for Business Server 2015. Make sure that a Windows Update was run and all updates are in place.
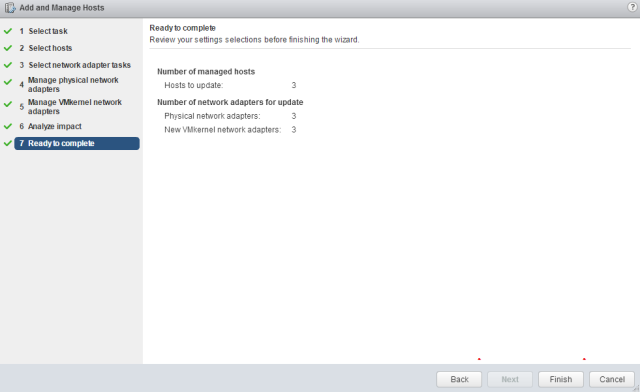
Unfortunately, you can not install Skype for business 2015 on the latest Windows Server 2016 and it is not yet supported.
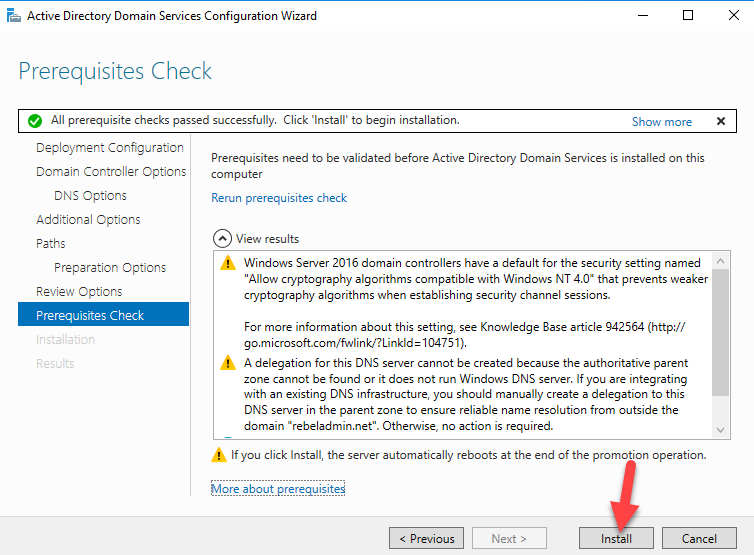
Preparing the Server 

The first step is to prepare the server to set up the Skype for Business Server 2015, the setup process can be initiated by running Y:\Setup\amd64\setup.exe (where Y: is the drive letter where the ISO was mounted).

The setup will install automatically the Microsoft Visual C++ 2013 which is a requirement for the installation process, and after that a location on the local disk must be defined to store the installation files, by default this location is C:\Program Files\Skype for Business Server 2015 folder.

Click on Install, the process will require acceptance of the license terms and after that a connection with the Internet to check the latest updates will be performed, wait for the completion and click on Next when the button becomes available.


The entire process to install Skype for Business Server 2015 is using the Deployment Wizard which is a wizard that has step by step how to deploy the entire solution, and it tracks the progress as we move forward with the product installation.


Before starting the Deployment Wizard, the server where the first Skype for Business Server (Front End role) will be installed will require a series of features, the best way to accomplish that is opening PowerShell as administrator and run the following cmdlet. After the completion, restart the server and then we can continue with the Skype for Business Server deployment process.

Add-WindowsFeature RSAT-ADDS, Web-Server, Web-Static-Content, Web-Default-Doc, Web-Http-Errors, Web-Asp-Net, Web-Net-Ext, Web-ISAPI-Ext, Web-ISAPI-Filter, Web-Http-Logging, Web-Log-Libraries, Web-Request-Monitor, Web-Http-Tracing, Web-Basic-Auth, Web-Windows-Auth, Web-Client-Auth, Web-Filtering, Web-Stat-Compression, Web-Dyn-Compression, NET-WCF-HTTP-Activation45, Web-Asp-Net45, Web-Mgmt-Tools, Web-Scripting-Tools, Web-Mgmt-Compat, Desktop-Experience, Telnet-Client


To continue the deployment process after the server restart, open up C:\Program Files\Skype for Business Server \Deployment and click on Deploy. The Deployment wizard will determine the deployment state and that may take a few seconds during the initial start.


Preparing Active Directory

The Active Directory preparation is composed of seven (7) steps altogether, but only three are preparation of the Active Directory and the other are checking and the last one is managing accounts to be administrator of the Skype for Business Server 2015 environment.

This operation will modify the current Active Directory, then the best practices requires to have replication in place and running smoothly, and a proper backup before starting this process. Also, you should have all FSMO up and running, we can check these servers by running netdom query fsmo.

The Deployment Wizard will list all steps in the proper order and they are numbered from Step 1 to Step 7 (Item 1), for each step we will have the Prerequisites and Help explaining the process (items 2 and 3), and finally the administrator can run the process using the graphical user interface (item 4). Keep in mind that in order to prepare Step 3, we must complete steps 1 and 2 otherwise the button will be grayed out.


The Prepare Schema (Steps 1 and 2), requires Schema Admins credentials to be performed, we can find that out by checking the Active Directory Users and Computers or running net user /domain and check if the Schema Admins has the current user as member.

After clicking on Run, a small wizard will be displayed, just click Next and then wait for the completion of the process (it may take a few minutes) and the last page of the wizard allows the administrator to check the logs of the operation.

If we want to be a little more thorough, we can open ADSIEdit.msc, connect to the Schema, search for CN=ms-RTC-SIP-SchemaVersion and check the attributes rangeLower and rangeUpper, they should have the values 3 and 1150 respectively.


The Prepare Current Forest (steps 3 and 4) requires Enterprise Admins privileges, and in this step the Skype for Business Server groups will be created in Active Directory (they all start with CS or RTC on their names). In order to prepare the forest, click on run and leave default settings to complete the preparation.

In order to check if the process was successful, check the Users container in Active Directory Users and Computers, and several groups related to Skype for Business should be listed. Make sure to give enough time for Active Directory replication to take place in larger environments.


The Prepare Current Domain (steps 5 and 6) will configure the proper permission for the groups created in the previous step, just click on Run and leave default settings to complete the wizard.

In order to check what was done during this process, we can look at the Security tab of the Active Directory domain object, and we will see at least four (4) entries for the RTC groups.


The final step of this preparation process is to add the future Skype for Business Administrators as part of the group CSAdministrator, by default that group is created empty.


Since we have prepared Active Directory to support Skype for Business Server 2015, we will continue the installation process in next step.

Preparing the environment

Preparing the environment to support the first Skype for Business Server deployment which includes DNS, Shared Folder and Central Management Store installation. Through the Deployment Wizard, we will perform two tasks:

  1. Install Administrative Tools and Prepare first Standard Edition Server
  2. Prepare the DNS to support Skype for Business and create a shared folder for the new deployment.


The first tasks (Install Administrative Tools) is a straight forward process, just leave default values and the installation process will add the basic tools to manage a Skype for Business Server environment, which are:

• Skype for Business Server Control Panel
• Skype for Business Deployment Wizard
• Skype for Business Server Management Shell
• Skype for Business Server Topology Builder

The second step is key to build the foundation for Skype for Business Server in your environment. The Prepare First Standard Edition server prepares the Standard Edition Server that we are going to use to host the CMS (Central Management Store).

The CMS is the central repository in Skype for Business Server solution, and it is around since Lync Server 2010. In that repository we will find the topology, configuration and policies in place on the environment. The CMS is protected and the only way to interact with it is through Topology Builder, Skype for Business Server Management Shell and Skype for Business Control Panel.

The process to prepare the CMS may take a little bit of time because involves SQL Server 2014 Express Edition installation and configuration, the preparation process will also create the Firewall exceptions to support SQL Server 2014.


Creating the Skype for Business Server share

During the initial topology creation, a shared folder will be required. We will use the same Skype for Business Server to host the shared folder. The Shared Folder requires only the local administrator group with Full Access permissions. In this article, we are using S4BShare as the name of the folder and share.


Configuring DNS Server to support Skype for Business Server

The DNS plays a key role when implementing Skype for Business Server, if the SIP domain that will be assigned to the future Skype for Business clients (usually the same as the SMTP address) is the same FQDN (Full Qualified Domain Name) of your Active Directory, then it is a piece of cake, your work will be just adding entries in the existent zone and we are good to go to the next phase. An example, my Active Directory FQDN is techsupportpk.com and my SMTP/SIP will be support@techsupportpk.com, that means that when I look at the DNS console I will have a zone called techsupportpk.com.

However, if the domain used by the SMTP/SIP is different from the Active Directory FQDN, then we need to decide how to configure the DNS, then we have a couple of options:

• Split-brain in this scenario, we create the zone internally and assign internal names for the Skype for Business services. For example: if the AD zone is techsupportpk.local and the SMTP/SIP is techsupportpk.com, we will create thetechsupportpk.com internally and all entries that are being used for the internal clients on the techsupportpk.com must be recreated internally.

• Automatic Configuration using Group Policies (GPOs) This method does not require DNS modifications, however, works only for domain joined machines.

• Pin-Point Internal Zones, using this method we create a dedicated zone for each record required in the DNS without creating a complete zone. Basically, the client would be able to resolve only the entries that we added, anything other than those zones will not be resolved by the DNS server.

The most elegant solution, in my humble opinion, is using the split-brain because it is easy to troubleshoot, you can use for different applications, such as Microsoft Exchange using Public Certificates, Office Online Server and etc.

The manual configuration consists of creating a zone for your SIP/SMTP domain in your internal DNS and add these following A records pointing out to the IP of the Skype for Business Server (our domain in this article will be techsupportpk.com):

• Admin.techsupportpk.com

• Dialin.techsupportpk.com

• Meet.techsupportpk.com

• Lyncdiscoverinternal.techsupportpk.com

• Scheduler.techsupportpk.com

The creation of the A records is straight forward, the tricky one is the SRV record, and in the picture below we can see the details required to be configured.


The Skype for Business Client will search these following entries when locating the service based on the SIP domain of the user entered:

1. Lyndiscoverinternal.techsupportpk.com (A Host), used by internal clients

2. Lyncdiscover.techsupportpk.com (A Host), used by external clients

3. _sipinternaltls._tcp.techsupportpk.com (SRV Record), used by internal clients

4. _sip._tls.techsupportpk.com (SRV record), used by external clients

5. Sipinternal.techsupportpk.com (A Host), used by internal clients

6. Sip.techsupportpk.com (A Host), used by internal clients

7. Sipexternal.techsupportpk.com (A Host), used by external clients

If you want to save time in this process, you can use the S4B-EasyDNS.ps1 script that was created to automate this process, basically you just need to run the script and pass the domain and the IP of the Skype for Business Server, and the DNS zone (if it does not exist) and all A and SRV records will be created automatically.

Note: This script must be executed on the DNS server.

# This script will create all entries required for Skype for Business Server 2015
#
#

$tmpDomain = $args[0]
$tmpIP = $args[1]
$tmpZone = get-dnsserverzone $tmpDomain -ErrorAction:Silent

If (($tmpzone).ZoneName -eq $null) {
    write-host 'Creating the Forward Zone' $tmpDomain
    Add-DnsServerPrimaryZone $tmpDomain -ReplicationScope Forest -DynamicUpdate None
    }

#Adding the DNS entries..
Add-DnsServerResourceRecord -ZoneName $tmpDomain -IPv4Address $tmpIP -A admin
Add-DnsServerResourceRecord -ZoneName $tmpDomain -IPv4Address $tmpIP -A dialin
Add-DnsServerResourceRecord -ZoneName $tmpDomain -IPv4Address $tmpIP -A meet
Add-DnsServerResourceRecord -ZoneName $tmpDomain -IPv4Address $tmpIP -A scheduler
Add-DnsServerResourceRecord -ZoneName $tmpDomain -IPv4Address $tmpIP -A lyncdiscoverinternal
Add-DnsServerResourceRecord -ZoneName $tmpDomain -IPv4Address $tmpIP -A sip
Add-DnsServerResourceRecord -ZoneName $tmpDomain -Srv -Name _sipinternaltls._tcp -DomainName ("sip." + $tmpDomain) -Port 5061 -Priority 0 -Weight 0 


Jailbreak iOS 10.1, iOS 10.1.1 on iPhone or iPad

$
0
0

This article will guide you through the steps to jailbreak iOS 10.1 and 10.1.1 on your iPhone or iPad using Yalu Jailbreak.


Jailbreak iOS 10 using Yalu Jailbreak and Cydia Impactor

1. Download the latest version of Cydia Impactor from here and Yalu Jailbreak IPA from here. As of this writing, the jailbreak IPA file is named mach_portal_yalu-b3.ipa.


2. Double click to open the Cydia Impactor .dmg file.


3. Drag and drop it into the Applications folder and launch it.


4. You may get a popup message like below. Choose “Open”.


5. Next, connect your iPhone or iPad to the computer via USB.

6. If Cydia Impactor recognizes your device, it will appear in the drop down list as shown below.


7. Drag and drop the Yalu IPA file onto Cydia Impactor.


8. You will be asked to enter your Apple ID and password. This information will be sent to Apple only and is used to sign the IPA file.

9. Once the app is installed on your device, you should see its icon on the Home screen labelled “mach_portal”.


10. To launch the app, you must first trust the developer profile. To do so, go to Settings -> General -> Profiles & Device Management and tap on the profile that has your email address.

11. Click the “Trust” button and confirm it.

12. Go back to the Home screen and launch the “mach_portal” app.

13. A white screen will be displayed for 15-20 seconds. This means that the jailbreak process has started. Do not do anything until the process is completed.

14. Once the jailbreak completes successfully, your device will reboot automatically and Cydia should appear on the Home screen.


There you go....your are now jailbroken

How To Configure Apache Virtual Hosts on Debian 8

$
0
0

The Apache web server is the most popular way of serving web content on the internet. Using virtual hosts, you can use one server to host multiple domains or sites off of a single interface or IP by using a matching mechanism. In easy words, you can host more than one web site on a single server.


This article will guide you through the steps to set up two Apache virtual hosts on a Debian 8 server, serving different content to visitors based on the domain they visit.

Prerequisites

  • One Debian 8 Server with a non-root user with sudo privileges.
  • Apache installed and configured

We'll create virtual hosts for example.com and test.com, but you can substitute your own domains or values while following along.

If you don't have domains available to test with, you can use example.com and test.com and follow Step 5 of this guide to configure your local hosts file to map those domains to your server's IP address. This will allow you to test your configuration from your local computer.

Creating the Directory Structure

The first step that we are going to take is to make a directory structure that will hold the site data that we will be serving to visitors.

Our document root, the top-level directory that Apache looks at to find content to serve, will be set to individual directories under the /var/www directory. We will create a directory for each of the virtual hosts we'll configure.

Within each of these directories, we'll create a folder called public_htmlthat will hold the web pages we want to serve. This gives us a little more flexibility in how we deploy more complex web applications in the future; the public_html folder will hold web content we want to serve, and the parent folder can hold scripts or application code to support web content.

Create the directories using the following commands:

sudo mkdir -p /var/www/example.com/public_html
sudo mkdir -p /var/www/test.com/public_html


Since we created the directories with sudo, they are owned by our root user. If we want our regular user to be able to modify files in our web directories, we change the ownership, like this:

sudo chown -R $USER:$USER /var/www/example.com/public_html 
sudo chown -R $USER:$USER /var/www/test.com/public_html

The $USER variable uses the value of the user you are currently logged in as when you press ENTER. By doing this, our regular user now owns the public_html subdirectories where we will be storing our content.

We should also modify our permissions a little bit to ensure that read access is permitted to the general web directory and all of the files and folders it contains so that pages can be served correctly. Execute this command to change the permissions on the /var/www folder and its children:

sudo chmod -R 755 /var/www

Your web server should now have the permissions it needs to serve content, and your user should be able to create content within the necessary folders. Let's create an HTML file for each site.

We have our directory structure in place. Let's create some content to serve. 

Creating Default Pages for Each Virtual Host

Let's create a simple index.html page for each site. This will help us ensure that our virtual hosts are configured properly later on.

Let's start with the page for example.com. Edit a new index.html file with the following command:

nano /var/www/example.com/public_html/index.html

In this file, create a simple HTML document that indicates that the visitor is looking at example.com's home page:

/var/www/example.com/public_html/index.html

Save and close the file when you are finished.

Now copy this file to the test.com site:

cp /var/www/example.com/public_html/index.html /var/www/test.com/public_html/index.html

Then open the file in your editor:

nano /var/www/test.com/public_html/index.html

Change the file so it references test.com instead of example.com:

/var/www/test.com/public_html/index.html

Save and close this file. You now have the pages necessary to test the virtual host configuration. Next, let's configure the virtual hosts.

Create New Virtual Host Files

Virtual host files specify the actual configuration of our virtual hosts and dictate how the Apache web server will respond to various domain requests.

Apache comes with a default virtual host file called 000-default.conf that you can use as a jumping off point. Copy this file for the first domain:

sudo cp /etc/apache2/sites-available/000-default.conf /etc/apache2/sites-available/example.com.conf

Note: The default Apache configuration in Debian 8 requires that each virtual host file end in .conf.

Open the new file in your editor:

sudo nano /etc/apache2/sites-available/example.com.conf

The file will look something like the following example, with some additional comments:
/etc/apache2/sites-available/example.com.conf
ServerAdmin webmaster@localhost

DocumentRoot /var/www/html
ErrorLog ${APACHE_LOG_DIR}/error.log

CustomLog ${APACHE_LOG_DIR}/access.log combined


This virtual host matches any requests that are made on port 80, the default HTTP port. Let's make a few changes to this configuration, and add a few new directives.

First, change the ServerAdmin directive to an email that the site administrator can receive emails through.
/etc/apache2/sites-available/example.com.conf

ServerAdmin admin@example.com

Next, we need to add two new directives. The first, called ServerName, establishes the base domain for this virtual host definition. The second, called ServerAlias, defines further names that should match as if they were the base name. This is useful for matching additional hosts you defined, so both example.comand www.example.com both work, provided both of these hosts point to this server's IP address.

Add these two directives to your configuration file, right after the ServerAdmin line:
/etc/apache2/sites-available/example.com.conf


ServerAdmin webmaster@localhost
ServerName example.com
ServerAlias www.example.com
DocumentRoot /var/www/html


Next, change the location of the document root for this domain by altering the DocumentRoot directive to point to the directory you created for this host:

DocumentRoot /var/www/example.com/public_html

Once you've made these changes, your file should look like this:
/etc/apache2/sites-available/example.com.conf


ServerAdmin admin@example.com
ServerName example.com
ServerAlias www.example.com
DocumentRoot /var/www/example.com/public_html
ErrorLog ${APACHE_LOG_DIR}/error.log
CustomLog ${APACHE_LOG_DIR}/access.log combined


Save and close the file.

Then create the second configuration file by creating a copy of this file:

sudo cp /etc/apache2/sites-available/example.com.conf /etc/apache2/sites-available/test.com.conf

Open the new file in your editor:

sudo nano /etc/apache2/sites-available/test.com.conf

Then change the relevant settings to reference your second domain. When you are finished, your file will look like this:

/etc/apache2/sites-available/test.com.conf
ServerAdmin admin@test.com
ServerName test.com
ServerAlias www.test.com
DocumentRoot /var/www/test.com/public_html
ErrorLog ${APACHE_LOG_DIR}/error.log
CustomLog ${APACHE_LOG_DIR}/access.log combined


Save and close the file.

Now that we have created our virtual host files, we can enable them.

Enabling the New Virtual Host Files

You've created the folders and the virtual host configuration files, but Apache won't use them until you activate them. You can use the a2ensite tool to enable each of your sites.

Activate the first site:

    sudo a2ensite example.com.conf

You'll see the following output if there were no syntax errors or typos in your file:

Output
Enabling site example.com.
To activate the new configuration, you need to run:

  service apache2 reload

In order for your changes to take effect, you have to reload Apache. But before you do, enable the other site:

    sudo a2ensite test.com.conf

You'll see a similar message indicating the site was enabled:

Output
Enabling site test.com.
To activate the new configuration, you need to run:

  service apache2 reload

Next, disable the default site defined in 000-default.conf by using the a2dissite command:

    sudo a2dissite 000-default.conf

Now, restart Apache:

    sudo systemctl restart apache2

The sites are now configured. Let's test them out. If you're using real domains configured to point to your server's IP address, you can skip the next step. But if your domains haven't propogated yet, or if you're just testing, read on to learn how to test this setup using your local computer.

Setting Up Local Hosts File (Optional)

If you haven't been using actual domain names that you own to test this procedure and have been using some example domains instead, you can at least test the functionality of this process by temporarily modifying the hosts file on your local computer.

This will intercept any requests for the domains that you configured and point them to your Apache server, just as the DNS system would do if you were using registered domains. This will only work from your computer though, and is only useful for testing purposes.

Make sure you follow these steps on your local computer, and not your Apache server. You will also need to know the local computer's administrative password or be a member of the administrative group.

If you are on a Mac or Linux computer, edit your local file with administrative privileges by typing:

    sudo nano /etc/hosts

If you're on Windows, open a Command Prompt with administrative privileges and type:

    notepad %windir%\system32\drivers\etc\hosts

Once you have the file open, add a line that maps your server's public IP address to each domain name, as shown in the following example:

/etc/hosts

127.0.0.1   localhost
...

111.111.111.111 example.com
111.111.111.111 test.com


This will direct any requests for example.com and test.com on your computer and send them to your server at 111.111.111.111.

Save and close the file. Now you can test out your setup. When you're confident things are working, remove the two lines from the file.

Testing Your Results

Now that you have your virtual hosts configured, you can test your setup easily by going to the domains that you configured in your web browser. Visit the first site at http://example.com and you'll see a page that looks like this:


Likewise, if you can visit your second host at http://test.com, you'll see the file you created for your second site:


If both of these sites work well, you've successfully configured two virtual hosts on the same server.

Note:If you adjusted your home computer's hosts file as shown in above step, you may want to delete the lines you added now that you verified that your configuration works. This will prevent your hosts file from being filled with entries that are not actually necessary. 


Conclusion

You now have a single server handling two separate domain names. You can expand this process by following these steps to add additional virtual hosts. There is no software limit on the number of domain names Apache can handle, so feel free to make as many as your server is capable of handling.

Jailbreak iOS 10.2

$
0
0

Recently Yalu team has finally released the latest build of the Yalu jailbreak with support for iOS 10.2. This article will show you how to jailbreak iOS 10.2 on your iPhone or iPad using Yalu Jailbreak. Remember, iOS 10.2 Yalu jailbreak now supports all 64-bit devices, except iPhone 7 and iPhone 7 Plus.


Jailbreak iOS 10.2

1. Download the latest version of Cydia Impactor from here and Yalu Jailbreak IPA for iOS 10.2 from here. As of this writing, the jailbreak IPA file is named yalu102_alpha.ipa.

2. Double click to open Cydia Impactor.


3. Connect your iPhone or iPad to your computer using a USB cable.

4. If Cydia Impactor recognizes your device, it will appear in the drop down list as shown below.


5. Drag and drop the Yalu IPA file onto Cydia Impactor.

6. You will be asked to enter your Apple ID and password. This information will be sent to Apple only and will be used to sign the IPA file.

7. Once the app is installed on your device, you should see its icon on the Home screen labelled “yalu102”.

8. To launch the app, you must first trust the developer profile. To do so, go to Settings -> General -> Profiles & Device Management and tap on the profile corresponding to the Apple ID you used in Cydia Impactor.

9. Press the “Trust” button.

10. Go back to the Home screen and launch the yalu102 app.

11. Press the Go button for the jailbreak to begin. Do not touch your device until the jailbreak is done.

12. Your device will reboot automatically and Cydia should appear on the Home screen. If it’s not there, open the yalu102 app and jailbreak again.


You are now jailbroken.

Jailbreak BioProtect Tweak

$
0
0

Since the iOS 10.2 jailbreak has been released, many Cydia developers have already started updating their tweaks for this firmware. Many popular tweaks have already received an update, such as Eclipse 4 which was released a few days back to bring dark mode to iOS 10.


Now another popular tweak has been updated for iOS 10. Namely BioProtect, this tweak allows you to protect any of your apps with Touch ID or passcode.


With BioProtect, you can protect access to apps, folders, Control Center items, various settings and much more. It is the ultimate tweak for protecting your jailbroken iOS 10 device from unauthorized access.

The best part of this tweak is the fingerprint animation that is displayed when you’re using Touch ID for authentication. The tweak also allows you to use a passcode instead of Touch ID. This means that you can use this tweak on devices that don’t come with Touch ID such as iPhone 5.

If you’ve been looking for a method to protect your jailbroken device from unauthorized access, then BioProtect is the right choice for you. 

Try it.
Viewing all 880 articles
Browse latest View live


<script src="https://jsc.adskeeper.com/r/s/rssing.com.1596347.js" async> </script>