Quantcast
Channel: Tech Support
Viewing all 880 articles
Browse latest View live

Google Buys iOS Time-Management App Vendor Timeful

$
0
0
Google acquired Timeful, a vendor of an iOS-only time-management application.  Will the app soon be available on Android devices? Google revealed that it acquired Timeful, a vendor of an iOS-only time-management application, for an undisclosed sum.

The purchase gives Google access to technology designed to let people organize and schedule daily activities more efficiently. The software's key feature is its ability to intelligently suggest times during the day or week for users to accomplish tasks on their to-do lists based on their habits and other scheduled events on their calendar.


"You can tell Timeful you want to exercise three times a week or that you need to call the bank by next Tuesday, and their system will make sure you get it done based on an understanding of both your schedule and your priorities," Google's Director of Product Development Alex Gawley said in announcing the purchase Monday.

Timeful's technology will work with Gmail, Google Inbox, Calendar and future time-management and scheduling apps from the company. "The Timeful team has built an impressive system that helps you organize your life by understanding your schedule, habits and needs," the company said.

In a notice announcing Google's purchase of the company, Timeful said that iPhone users would be able to continue to download and use the mobile app as always. Users who choose to can also export their data from the site at any time. Moving forward, Timeful will focus on developing new projects in conjunction with Google, the company said.

Timeful is a free application first introduced in Apple's Play store just last July. It works with iCal, Outlook and Google Cal. The application brings together into the Calendar, the user's scheduled events, to-do items and habits, such as daily jogging or walking. It then runs what the company has described as sophisticated algorithms to figure out the optimal times during the day or week for the user to accomplish items on their list of things to do.

Mobile-application ranking Website App Annie describes Timeful as an application that learns from the user's behavior, adapts to his or her schedule and gets better at personalizing recommendations with continued use over time.  "Timeful brings everything that competes for your time together into one place–your meetings, events, to-dos, and even good habits you're looking to develop," App Annie noted in its description of the software. Some, like Business Insider have rated Timeful as an extremely useful application for iOS users.

User response to the application itself, however, appears somewhat muted. Soon after its release last year, the application ranked briefly among the top productivity applications for iOS in App Annie. But in the past several months, it has ranked well below 100 in most of the markets in which it is available. At the time of Google's announcement Monday, Timeful ranked 456 among the list of most popular productivity applications for iOS in the United States.

A handful of user reviews on Apple's iTunes appeared to reflect some frustration among users with recent tweaks to the product
"I used your app faithfully for months and had a good understanding of how it worked," a reviewer using the handle Michaelphd noted. "It was my favorite calendar/to-do app by far. But when you started forcing my to-do's into my calendar, I deleted the app."

Another reviewer going by the name bro12345621 lamented Timeful's decision to do away with its suggestions feature altogether. "Automatically setting times for tasks without my consent just leads to annoying notifications unless I take the time to reschedule every single one I don't want to do."

It's too soon to say what Google's plans for the product are, but some might assume that the company will make a version of Timeful available for Android users as well.

Rombertik Malware Corrupts Drives to Prevent Code Analysis

$
0
0
The malware, which attempts to steal information about Web sites and users, deletes the master boot record—or all user files—to avoid detection, according to a Cisco analysis.

Attackers are adopting increasingly malicious tactics to evade security researchers’ analysis efforts, with a recently-discovered data-stealing program erasing the master boot record of a system’s hard drive if it detects signs of an analysis environment, according to report published by Cisco on May 4.

The malware, dubbed Rombertik, compromises systems and attempts to steal information, such as login credentials and personal information, from the victim’s browser sessions, researchers with Cisco’s Talos security intelligence group stated in the report.

When the malware installs itself, the software runs several anti-analysis checks, attempting to determine if the system on which it is running is an analysis environment. If the last check fails, the malware deletes the master boot record, or MBR, which is required to correctly start up the computer system.

“The interesting bit with Rombertik is that we are seeing malware authors attempting to be incredibility evasive,” Alexander Chiu, a threat researcher with Cisco, said in an e-mail. “If Rombertik detects it’s being analyzed running in memory, it actively tries to trash the MBR of the computer it’s running on. This is not common behavior.”

Attackers are increasingly attempting to prevent defenders from analyzing the tools and programs they use to conduct criminal and espionage operations. In a recent analysis, researchers with security firm Seculert found a variant of the Dyre banking trojan that used a simple check—counting the number of processing cores—to detect if it was in a virtual environment.

Rombertik has been identified to propagate via spam and phishing messages sent to would-be victims.  Like previous spam and phishing campaigns Talos has discussed, attackers use social engineering tactics to entice users to download, unzip, and open the attachments that ultimately result in the user’s compromise.


“At a high level, Rombertik is a complex piece of malware that is designed to hook into the user’s browser to read credentials and other sensitive information for exfiltration to an attacker controlled server, similar to Dyre,” Cisco’s researchers stated in the report. “However, unlike Dyre which was designed to target banking information, Rombertik collects information from all websites in an indiscriminate manner.”

Rombertik is distributed through various spam campaigns, often camouflaged as a PDF file. In reality, the attachment is a screensaver executable which, if the user opens the binary, attempts to run on the system. The prevalence of the malware is currently not known.

During an installation attempt, Rombertik attempts multiple times to determine if it might be in an analysis environment. The program has a lot of unused code, including uncalled functions and images which the malware authors included to try to camouflage the malware’s functionality, Cisco’s researchers stated.

The program also attempts to outlast automated analysis by writing a byte to memory nearly a billion times. Automated systems are often designed to run for a limited length of time, so as to efficiently process as many files as possible. The technique of writing data so many times could potentially crash some environments, Cisco stated.

“If an analysis tool attempted to log all of the 960 million write instructions, the log would grow to over 100 gigabytes,” the researchers said. “Even if the analysis environment was capable of handling a log that large, it would take over 25 minutes just to write that much data to a typical hard drive. This complicates analysis.”

When it reaches its final check, Rombertik deletes the MBR—or if it's unable to— it deletes all files in the user’s account, according to Cisco.

Ace Translator 14.5 with Text-to-Speech Full Version for Windows

$
0
0

Ace Translator employs the power of Internet machine language translation engines, and enables you to easily translate Web contents, letters, chat, and emails between major International languages. The new version 14 supports 91 languages, and with text-to-speech (TTS) support for 46 languages, which makes it an ideal language learning app as well.


 Download

Ace Translator supports translations between the following 91 languages. Languages marked with  have TTS feature enabled.

   English
   Latin
   French     Français
   German     Deutsch
   Italian     Italiano
   Dutch     Nederlands
   Portuguese     português
   Spanish     Español
   Catalan     català
   Greek     Ελληνικά
   Russian     русский
   Chinese (Simplified)     中文(简体)
   Chinese (Traditional)     中文(繁體)
   Japanese     日本語
   Korean     한국어
   Finnish     suomi
   Czech     čeština
   Danish     Dansk
   Romanian     Română
   Bulgarian     български
   Croatian     hrvatski
   Urdu     اردو
   Punjabi     ਪੰਜਾਬੀ
   Tamil     தமிழ்
   Hindi     हिन्दी
   Gujarati     ગુજરાતી
   Kannada     ಕನ್ನಡ
   Telugu     తెలుగు
   Marathi     मराठी
   Malayalam     മലയാളം
   Bengali     বাংলা
   Indonesian     Bahasa Indonesia
   Javanese     Basa Jawa
   Filipino
   Cebuano
   Latvian     latviešu
   Lithuanian     lietuvių
   Norwegian     norsk
   Serbian     српски
   Ukrainian     українська
   Slovak     slovenčina
   Slovenian     slovenščina
   Swedish     svenska
   Polish     polski
   Vietnamese     Tiếng Việt
   Arabic     العربية
   Hebrew     עברית
   Turkish     Türkçe
   Hungarian     magyar
   Thai     ภาษาไทย
   Albanian     Shqip
   Maltese     Malti
   Estonian     eesti
   Belarusian     беларуская
   Icelandic     íslenska
   Malay     Bahasa Melayu
   Irish     Gaeilge
   Macedonian     македонски
   Persian     فارسی
   Galician     galego
   Welsh     Cymraeg
   Yiddish     אידיש
   Zulu     isiZulu
   Afrikaans
   Swahili     Kiswahili
   Hausa     Harshen Hausa
   Haitian Creole     Kreyòl Ayisyen
   Armenian     հայերեն
   Azerbaijani     Azərbaycanca
   Georgian     ქართული
   Basque     euskara
   Esperanto
   Bosnian     bosanski
   Hmong
   Lao     ພາສາລາວ
   Khmer     ភាសាខ្មែរ
   Burmese     မြန်မာဘာသာ
   Igbo     Asụsụ Igbo
   Yoruba     Èdè Yorùbá
   Maori     Māori
   Nepali     नेपाली
   Somali     Soomaali
   Mongolian     Монгол
   Sinhala     සිංහල
   Tajik     Тоҷикӣ
   Uzbek     O‘zbek
   Kazakh     қазақ
   Sundanese     Basa Sunda
   Sesotho
   Malagasy

   Chichewa
  

System Requirements:
Microsoft Windows 10/8.1/7/Vista/XP/2012/2008/2003
An active Internet connection

Linux Systemd Essentials: Working with Services, Units, and the Journal

$
0
0
In recent years, Linux distributions have increasingly transitioned from other init systems to systemd. Thesystemd suite of tools provides a fast and flexible init model for managing an entire machine from boot onwards.

In this guide, we'll give you a quick run through of the most important commands you'll want to know for managing a systemd enabled server. These should work on any server that implements systemd (any OS version at or above Ubuntu 15.04, Debian 8, CentOS 7, Fedora 15). Let's get started.


Basic Unit Management

The basic object that systemd manages and acts upon is a "unit". Units can be of many types, but the most common type is a "service" (indicated by a unit file ending in .service). To manage services on asystemd enabled server, our main tool is the systemctl command.

All of the normal init system commands have equivalent actions with the systemctl command. We will use the nginx.service unit to demonstrate (you'll have to install Nginx with your package manager to get this service file).

For instance, we can start the service by typing:
sudo systemctl start nginx.service

We can stop it again by typing:
sudo systemctl stop nginx.service

To restart the service, we can type:
sudo systemctl restart nginx.service

To attempt to reload the service without interrupting normal functionality, we can type:
sudo systemctl reload nginx.service

Enabling or Disabling Units

By default, most systemd unit files are not started automatically at boot. To configure this functionality, you need to "enable" to unit. This hooks it up to a certain boot "target", causing it to be triggered when that target is started.

To enable a service to start automatically at boot, type:
sudo systemctl enable nginx.service

If you wish to disable the service again, type:
sudo systemctl disable nginx.service

Getting an Overview of the System State

There is a great deal of information that we can pull from a systemd server to get an overview of the system state.

For instance, to get all of the unit files that systemd has listed as "active", type (you can actually leave off the list-units as this is the default systemctl behavior):

  • systemctl list-units


To list all of the units that systemd has loaded or attempted to load into memory, including those that are not currently active, add the --all switch:

  • systemctl list-units --all


To list all of the units installed on the system, including those that systemd has not tried to load into memory, type:

  • systemctl list-unit-files


Viewing Basic Log Information

systemd component called journald collects and manages journal entries from all parts of the system. This is basically log information from applications and the kernel.

To see all log entries, starting at the oldest entry, type:

  • journalctl


By default, this will show you entries from the current and previous boots if journald is configured to save previous boot records. Some distributions enable this by default, while others do not (to enable this, either edit the /etc/systemd/journald.conf file and set the Storage= option to "persistent", or create the persistent directory by typing sudo mkdir -p /var/log/journal).

If you only wish to see the journal entries from the current boot, add the -b flag:

  • journalctl -b


To see only kernel messages, such as those that are typically represented by dmesg, you can use the -kflag:

  • journalctl -k


Again, you can limit this only to the current boot by appending the -b flag:
journalctl -k -b

Querying Unit States and Logs

While the above commands gave you access to the general system state, you can also get information about the state of individual units.

To see an overview of the current state of a unit, you can use the status option with the systemctlcommand. This will show you whether the unit is active, information about the process, and the latest journal entries:

  • systemctl status nginx.service


To see all of the journal entries for the unit in question, give the -u option with the unit name to thejournalctl command:

  • journalctl -u nginx.service


As always, you can limit the entries to the current boot by adding the -b flag:
journalctl -b -u nginx.service

Inspecting Units and Unit Files

By now, you know how to modify a unit's state by starting or stopping it, and you know how to view state and journal information to get an idea of what is happening with the process. However, we haven't seen yet how to inspect other aspects of units and unit files.

A unit file contains the parameters that systemd uses to manage and run a unit. To see the full contents of a unit file, type:

  • systemctl cat nginx.service


To see the dependency tree of a unit (which units systemd will attempt to activate when starting the unit), type:

  • systemctl list-dependencies nginx.service


This will show the dependent units, with target units recursively expanded. To expand all dependent units recursively, pass the --all flag:

  • systemctl list-dependencies --all nginx.service


Finally, to see the low-level details of the unit's settings on the system, you can use the show option:

  • systemctl show nginx.service


This will give you the value of each parameter being managed by systemd.

Modifying Unit Files

If you need to make a modification to a unit file, systemd allows you to make changes from thesystemctl command itself so that you don't have to go to the actual disk location.

To add a unit file snippet, which can be used to append or override settings in the default unit file, simply call the edit option on the unit:

  • sudo systemctl edit nginx.service


If you prefer to modify the entire content of the unit file instead of creating a snippet, pass the --full flag:

  • sudo systemctl edit --full nginx.service


After modifying a unit file, you should reload the systemd process itself to pick up your changes:

  • sudo systemctl daemon-reload


Using Targets (Runlevels)

Another function of an init system is to transition the server itself between different states. Traditional init systems typically refer to these as "runlevels", allowing the system to only be in one runlevel at any one time.

In systemd, "targets" are used instead. Targets are basically synchronization points that the server can used to bring the server into a specific state. Service and other unit files can be tied to a target and multiple targets can be active at the same time.

To see all of the targets available on your system, type:

  • systemctl list-unit-files --type=target


To view the default target that systemd tries to reach at boot (which in turn starts all of the unit files that make up the dependency tree of that target), type:

  • systemctl get-default


You can change the default target that will be used at boot by using the set-default option:

  • sudo systemctl set-default multi-user.target


To see what units are tied to a target, you can type:

  • systemctl list-dependencies multi-user.target


You can modify the system state to transition between targets with the isolate option. This will stop any units that are not tied to the specified target. Be sure that the target you are isolating does not stop any essential services:

  • sudo systemctl isolate multi-user.target


Stopping or Rebooting the Server

For some of the major states that a system can transition to, shortcuts are available. For instance, to power off your server, you can type:

  • sudo systemctl poweroff


If you wish to reboot the system instead, that can be accomplished by typing:

  • sudo systemctl reboot


You can boot into rescue mode by typing:

  • sudo systemctl rescue


Note that most operating systems include traditional aliases to these operations so that you can simply type sudo poweroff or sudo reboot without the systemctl. However, this is not guaranteed to be set up on all systems.

Next Steps

By now, you should know the basics of how to manage a server that uses systemd. However, there is much more to learn as your needs expand. Below are links to guides with more in-depth information about some of the components we discussed in this guide:

How To Use Systemctl to Manage Systemd Services and Units


Introduction

Systemd is an init system and system manager that is widely becoming the new standard for Linux machines. While there are considerable opinions about whether systemd is an improvement over the traditional SysV init systems it is replacing, the majority of distributions plan to adopt it or have already done so.

Due to its heavy adoption, familiarizing yourself with systemd is well worth the trouble, as it will make administrating these servers considerably easier. Learning about and utilizing the tools and daemons that comprise systemd will help you better appreciate the power, flexibility, and capabilities it provides, or at least help you to do your job with minimal hassle.

In this guide, we will be discussing the systemctl command, which is the central management tool for controlling the init system. We will cover how to manage services, check statuses, change system states, and work with the configuration files.

Service Management

The fundamental purpose of an init system is to initialize the components that must be started after the Linux kernel is booted (traditionally known as "userland" components). The init system is also used to manage services and daemons for the server at any point while the system is running. With that in mind, we will start with some simple service management operations.

In systemd, the target of most actions are "units", which are resources that systemd knows how to manage. Units are categorized by the type of resource they represent and they are defined with files known as unit files. The type of each unit can be inferred from the suffix on the end of the file.

For service management tasks, the target unit will be service units, which have unit files with a suffix of.service. However, for most service management commands, you can actually leave off the .servicesuffix, as systemd is smart enough to know that you probably want to operate on a service when using service management commands.


Starting and Stopping Services

To start a systemd service, executing instructions in the service's unit file, use the start command. If you are running as a non-root user, you will have to use sudo since this will affect the state of the operating system:
sudo systemctl start application.service

As we mentioned above, systemd knows to look for *.service files for service management commands, so the command could just as easily be typed like this:
sudo systemctl start application

Although you may use the above format for general administration, for clarity, we will use the .servicesuffix for the remainder of the commands to be explicit about the target we are operating on.

To stop a currently running service, you can use the stop command instead:
sudo systemctl stop application.service


Restarting and Reloading

To restart a running service, you can use the restart command:
sudo systemctl restart application.service

If the application in question is able to reload its configuration files (without restarting), you can issue thereload command to initiate that process:
sudo systemctl reload application.service

If you are unsure whether the service has the functionality to reload its configuration, you can issue thereload-or-restart command. This will reload the configuration in-place if available.

Otherwise, it will restart the service so the new configuration is picked up:
sudo systemctl reload-or-restart application.service


Enabling and Disabling Services

The above commands are useful for starting or stopping commands during the current session. To tellsystemd to start services automatically at boot, you must enable them.

To start a service at boot, use the enable command:
sudo systemctl enable application.service

This will create a symbolic link from the system's copy of the service file (usually in /lib/systemd/systemor /etc/systemd/system) into the location on disk where systemd looks for autostart files (usually/etc/systemd/system/some_target.target.wants. We will go over what a target is later in this guide).

To disable the service from starting automatically, you can type:
sudo systemctl disable application.service

This will remove the symbolic link that indicated that the service should be started automatically.

Keep in mind that enabling a service does not start it in the current session. If you wish to start the service and enable it at boot, you will have to issue both the start and enable commands.


Checking the Status of Services

To check the status of a service on your system, you can use the status command:
systemctl status application.service

This will provide you with the service state, the cgroup hierarchy, and the first few log lines.

For instance, when checking the status of an Nginx server, you may see output like this:
● nginx.service - A high performance web server and a reverse proxy server
Loaded: loaded (/usr/lib/systemd/system/nginx.service; enabled; vendor preset: disabled)
Active: active (running) since Tue 2015-01-27 19:41:23 EST; 22h ago
Main PID: 495 (nginx)
CGroup: /system.slice/nginx.service
├─495 nginx: master process /usr/bin/nginx -g pid /run/nginx.pid; error_log stderr;
└─496 nginx: worker process

Jan 27 19:41:23 desktop systemd[1]: Starting A high performance web server and a reverse proxy server...
Jan 27 19:41:23 desktop systemd[1]: Started A high performance web server and a reverse proxy server.

This gives you a nice overview of the current status of the application, notifying you of any problems and any actions that may be required.

There are also methods for checking for specific states. For instance, to check to see if a unit is currently active (running), you can use the is-active command:
systemctl is-active application.service

This will return the current unit state, which is usually active or inactive. The exit code will be "0" if it is active, making the result simpler to parse programatically.

To see if the unit is enabled, you can use the is-enabled command:
systemctl is-enabled application.service

This will output whether the service is enabled or disabled and will again set the exit code to "0" or "1" depending on the answer to the command question.
A third check is whether the unit is in a failed state. This indicates that there was a problem starting the unit in question:
systemctl is-failed application.service

This will return active if it is running properly or failed if an error occurred. If the unit was intentionally stopped, it may return unknown or inactive. An exit status of "0" indicates that a failure occurred and an exit status of "1" indicates any other status.


System State Overview

The commands so far have been useful for managing single services, but they are not very helpful for exploring the current state of the system. There are a number of systemctl commands that provide this information.


Listing Current Units

To see a list of all of the active units that systemd knows about, we can use the list-units command:
systemctl list-units

This will show you a list of all of the units that systemd currently has active on the system. The output will look something like this:
UNIT                                      LOAD   ACTIVE SUB     DESCRIPTION
atd.service loaded active running ATD daemon
avahi-daemon.service loaded active running Avahi mDNS/DNS-SD Stack
dbus.service loaded active running D-Bus System Message Bus
dcron.service loaded active running Periodic Command Scheduler
dkms.service loaded active exited Dynamic Kernel Modules System
getty@tty1.service loaded active running Getty on tty1

. . .
The output has the following columns:
  • UNIT: The systemd unit name
  • LOAD: Whether the unit's configuration has been parsed by systemd. The configuration of loaded units is kept in memory.
  • ACTIVE: A summary state about whether the unit is active. This is usually a fairly basic way to tell if the unit has started successfully or not.
  • SUB: This is a lower-level state that indicates more detailed information about the unit. This often varies by unit type, state, and the actual method in which the unit runs.
  • DESCRIPTION: A short textual description of what the unit is/does.
Since the list-units command shows only active units by default, all of the entries above will show "loaded" in the LOAD column and "active" in the ACTIVE column. This display is actually the default behavior of systemctl when called without additional commands, so you will see the same thing if you call systemctl with no arguments:
systemctl

We can tell systemctl to output different information by adding additional flags. For instance, to see all of the units that systemd has loaded (or attempted to load), regardless of whether they are currently active, you can use the --all flag, like this:
systemctl list-units --all

This will show any unit that systemd loaded or attempted to load, regardless of its current state on the system. Some units become inactive after running, and some units that systemd attempted to load may have not been found on disk.

You can use other flags to filter these results. For example, we can use the --state= flag to indicate the LOAD, ACTIVE, or SUB states that we wish to see. You will have to keep the --all flag so thatsystemctl allows non-active units to be displayed:
systemctl list-units --all --state=inactive

Another common filter is the --type= filter. We can tell systemctl to only display units of the type we are interested in. For example, to see only active service units, we can use:
systemctl list-units --type=service


Listing All Unit Files

The list-units command only displays units that systemd has attempted to parse and load into memory. Since systemd will only read units that it thinks it needs, this will not necessarily include all of the available units on the system. To see every available unit file within the systemd paths, including those that systemd has not attempted to load, you can use the list-unit-files command instead:
systemctl list-unit-files

Units are representations of resources that systemd knows about. Since systemd has not necessarily read all of the unit definitions in this view, it only presents information about the files themselves. The output has two columns: the unit file and the state.
UNIT FILE                                  STATE   
proc-sys-fs-binfmt_misc.automount static
dev-hugepages.mount static
dev-mqueue.mount static
proc-fs-nfsd.mount static
proc-sys-fs-binfmt_misc.mount static
sys-fs-fuse-connections.mount static
sys-kernel-config.mount static
sys-kernel-debug.mount static
tmp.mount static
var-lib-nfs-rpc_pipefs.mount static
org.cups.cupsd.path enabled

. . .
The state will usually be "enabled", "disabled", "static", or "masked". In this context, static means that the unit file does not contain an "install" section, which is used to enable a unit. As such, these units cannot be enabled. Usually, this means that the unit performs a one-off action or is used only as a dependency of another unit and should not be run by itself.

We will cover what "masked" means momentarily.


Unit Management

So far, we have been working with services and displaying information about the unit and unit files thatsystemd knows about. However, we can find out more specific information about units using some additional commands.


Displaying a Unit File

To display the unit file that systemd has loaded into its system, you can use the cat command (this was added in systemd version 209). For instance, to see the unit file of the atd scheduling daemon, we could type:
systemctl cat atd.service
[Unit]
Description=ATD daemon

[Service]
Type=forking
ExecStart=/usr/bin/atd

[Install]
WantedBy=multi-user.target

The output is the unit file as known to the currently running systemd process. This can be important if you have modified unit files recently or if you are overriding certain options in a unit file fragment (we will cover this later).


Displaying Dependencies

To see a unit's dependency tree, you can use the list-dependencies command:
systemctl list-dependencies sshd.service

This will display a hierarchy mapping the dependencies that must be dealt with in order to start the unit in question. Dependencies, in this context, include those units that are either required by or wanted by the units above it.
sshd.service
├─system.slice
└─basic.target
├─microcode.service
├─rhel-autorelabel-mark.service
├─rhel-autorelabel.service
├─rhel-configure.service
├─rhel-dmesg.service
├─rhel-loadmodules.service
├─paths.target
├─slices.target

. . .
The recursive dependencies are only displayed for .target units, which indicate system states. To recursively list all dependencies, include the --all flag.

To show reverse dependencies (units that depend on the specified unit), you can add the --reverse flag to the command. Other flags that are useful are the --before and --after flags, which can be used to show units that depend on the specified unit starting before and after themselves, respectively.


Checking Unit Properties

To see the low-level properties of a unit, you can use the show command. This will display a list of properties that are set for the specified unit using a key=value format:
systemctl show sshd.service
Id=sshd.service
Names=sshd.service
Requires=basic.target
Wants=system.slice
WantedBy=multi-user.target
Conflicts=shutdown.target
Before=shutdown.target multi-user.target
After=syslog.target network.target auditd.service systemd-journald.socket basic.target system.slice
Description=OpenSSH server daemon

. . .
If you want to display a single property, you can pass the -p flag with the property name. For instance, to see the conflicts that the sshd.service unit has, you can type:
systemctl show sshd.service -p Conflicts
Conflicts=shutdown.target


Masking and Unmasking Units

We saw in the service management section how to stop or disable a service, but systemd also has the ability to mark a unit as completely unstartable, automatically or manually, by linking it to /dev/null. This is called masking the unit, and is possible with the mask command:
sudo systemctl mask nginx.service

This will prevent the Nginx service from being started, automatically or manually, for as long as it is masked.

If you check the list-unit-files, you will see the service is now listed as masked:
systemctl list-unit-files
. . .

kmod-static-nodes.service static
ldconfig.service static
mandb.service static
messagebus.service static
nginx.service masked
quotaon.service static
rc-local.service static
rdisc.service disabled
rescue.service static

. . .
If you attempt to start the service, you will see a message like this:
sudo systemctl start nginx.service
Failed to start nginx.service: Unit nginx.service is masked.

To unmask a unit, making it available for use again, simply use the unmask command:
sudo systemctl unmask nginx.service

This will return the unit to its previous state, allowing it to be started or enabled.


Editing Unit Files

While the specific format for unit files is outside of the scope of this tutorial, systemctl provides builtin mechanisms for editing and modifying unit files if you need to make adjustments. This functionality was added in systemd version 218.

The edit command, by default, will open a unit file snippet for the unit in question:
sudo systemctl edit nginx.service

This will be a blank file that can be used to override or add directives to the unit definition. A directory will be created within the /etc/systemd/system directory which contains the name of the unit with .dappended. For instance, for the nginx.service, a directory called nginx.service.d will be created.

Within this directory, a snippet will be created called override.conf. When the unit is loaded, systemdwill, in memory, merge the override snippet with the full unit file. The snippet's directives will take precedence over those found in the original unit file.

If you wish to edit the full unit file instead of creating a snippet, you can pass the --full flag:
sudo systemctl edit --full nginx.service

This will load the current unit file into the editor, where it can be modified. When the editor exits, the changed file will be written to /etc/systemd/system, which will take precedence over the system's unit definition (usually found somewhere in /lib/systemd/system).

To remove any additions you have made, either delete the unit's .d configuration directory or the modified service file from /etc/systemd/system. For instance, to remove a snippet, we could type:
sudo rm -r /etc/systemd/system/nginx.service.d

To remove a full modified unit file, we would type:
sudo rm /etc/systemd/system/nginx.service

After deleting the file or directory, you should reload the systemd process so that it no longer attempts to reference these files and reverts back to using the system copies. You can do this by typing:
sudo systemctl daemon-reload


Adjusting the System State (Runlevel) with Targets

Targets are special unit files that describe a system state or synchronization point. Like other units, the files that define targets can be identified by their suffix, which in this case is .target. Targets do not do much themselves, but are instead used to group other units together.

This can be used in order to bring the system to certain states, much like other init systems use runlevels. They are used as a reference for when certain functions are available, allowing you to specify the desired state instead of the individual units needed to produce that state.

For instance, there is a swap.target that is used to indicate that swap is ready for use. Units that are part of this process can sync with this target by indicating in their configuration that they are WantedBy= orRequiredBy= the swap.target. Units that require swap to be available can specify this condition using the Wants=Requires=, and After= specifications to indicate the nature of their relationship.


Getting and Setting the Default Target

The systemd process has a default target that it uses when booting the system. Satisfying the cascade of dependencies from that single target will bring the system into the desired state. To find the default target for your system, type:
systemctl get-default
multi-user.target

If you wish to set a different default target, you can use the set-default. For instance, if you have a graphical desktop installed and you wish for the system to boot into that by default, you can change your default target accordingly:
sudo systemctl set-default graphical.target

Listing Available Targets

You can get a list of the available targets on your system by typing:
systemctl list-unit-files --type=target

Unlike runlevels, multiple targets can be active at one time. An active target indicates that systemd has attempted to start all of the units tied to the target and has not tried to tear them down again. To see all of the active targets, type:
systemctl list-units --type=target


Isolating Targets

It is possible to start all of the units associated with a target and stop all units that are not part of the dependency tree. The command that we need to do this is called, appropriately, isolate. This is similar to changing the runlevel in other init systems.

For instance, if you are operating in a graphical environment with graphical.target active, you can shut down the graphical system and put the system into a multi-user command line state by isolating themulti-user.target. Since graphical.target depends on multi-user.target but not the other way around, all of the graphical units will be stopped.

You may wish to take a look at the dependencies of the target you are isolating before performing this procedure to ensure that you are not stopping vital services:
systemctl list-dependencies multi-user.target

When you are satisfied with the units that will be kept alive, you can isolate the target by typing:
sudo systemctl isolate multi-user.target


Using Shortcuts for Important Events

There are targets defined for important events like powering off or rebooting. However, systemctl also has some shortcuts that add a bit of additional functionality.

For instance, to put the system into rescue (single-user) mode, you can just use the rescue command instead of isolate rescue.target:
sudo systemctl rescue

This will provide the additional functionality of alerting all logged in users about the event.
To halt the system, you can use the halt command:
sudo systemctl halt

To initiate a full shutdown, you can use the poweroff command:
sudo systemctl poweroff

A restart can be started with the reboot command:
sudo systemctl reboot

These all alert logged in users that the event is occurring, something that simply running or isolating the target will not do. Note that most machines will link the shorter, more conventional commands for these operations so that they work properly with systemd.

For example, to reboot the system, you can usually type:
sudo reboot


Conclusion

By now, you should be familiar with some of the basic capabilities of the systemctl command that allow you to interact with and control your systemd instance. The systemctl utility will be your main point of interaction for service and system state management.

While systemctl operates mainly with the core systemd process, there are other components to thesystemd ecosystem that are controlled by other utilities. Other capabilities, like log management and user sessions are handled by separate daemons and management utilities (journald/journalctl andlogind/loginctl respectively). Taking time to become familiar with these other tools and daemons will make management an easier task.


How To Use Journalctl to View and Manipulate Systemd Logs


Introduction

Some of the most compelling advantages of systemd are those involved with process and system logging. When using other tools, logs are usually dispersed throughout the system, handled by different daemons and processes, and can be fairly difficult to interpret when they span multiple applications.Systemd attempts to address these issues by providing a centralized management solution for logging all kernel and userland processes. The system that collects and manages these logs is known as the journal.

The journal is implemented with the journald daemon, which handles all of the messages produced by the kernel, initrd, services, etc. In this guide, we will discuss how to use the journalctl utility, which can be used to access and manipulate the data held within the journal.


General Idea

One of the impetuses behind the systemd journal is to centralize the management of logs regardless of where the messages are originating. Since much of the boot process and service management is handled by the systemd process, it makes sense to standardize the way that logs are collected and accessed. Thejournald daemon collects data from all available sources and stores them in a binary format for easy and dynamic manipulation.

This gives us a number of significant advantages. By interacting with the data using a single utility, administrators are able to dynamically display log data according to their needs. This can be as simple as viewing the boot data from three boots ago, or combining the log entries sequentially from two related services to debug a communication issue.

Storing the log data in a binary format also means that the data can be displayed in arbitrary output formats depending on what you need at the moment. For instance, for daily log management you may be used to viewing the logs in the standard syslog format, but if you decide to graph service interruptions later on, you can output each entry as a JSON object to make it consumable to your graphing service. Since the data is not written to disk in plain text, no conversion is needed when you need a different on-demand format.

The systemd journal can either be used with an existing syslog implementation, or it can replace thesyslog functionality, depending on your needs. While the systemd journal will cover most administrator's logging needs, it can also complement existing logging mechanisms. For instance, you may have a centralized syslog server that you use to compile data from multiple servers, but you also may wish to interleave the logs from multiple services on a single system with the systemd journal. You can do both of these by combining these technologies.


Setting the System Time

One of the benefits of using a binary journal for logging is the ability to view log records in UTC or local time at will. By default, systemd will display results in local time.

Because of this, before we get started with the journal, we will make sure the timezone is set up correctly. The systemd suite actually comes with a tool called timedatectl that can help with this.

First, see what timezones are available with the list-timezones option:
timedatectl list-timezones

This will list the timezones available on your system. When you find the one that matches the location of your server, you can set it by using the set-timezone option:
sudo timedatectl set-timezone zone

To ensure that your machine is using the correct time now, use the timedatectl command alone, or with the status option. The display will be the same:
timedatectl status
Local time: Thu 2015-02-05 14:08:06 EST
Universal time: Thu 2015-02-05 19:08:06 UTC
RTC time: Thu 2015-02-05 19:08:06
Time zone: America/New_York (EST, -0500)
NTP enabled: no
NTP synchronized: no
RTC in local TZ: no
DST active: n/a

The first line should display the correct time.


Basic Log Viewing

To see the logs that the journald daemon has collected, use the journalctl command.
When used alone, every journal entry that is in the system will be displayed within a pager (usually less) for you to browse. The oldest entries will be up top:
journalctl
-- Logs begin at Tue 2015-02-03 21:48:52 UTC, end at Tue 2015-02-03 22:29:38 UTC. --
Feb 03 21:48:52 localhost.localdomain systemd-journal[243]: Runtime journal is using 6.2M (max allowed 49.
Feb 03 21:48:52 localhost.localdomain systemd-journald[139]: Received SIGTERM from PID 1 (systemd).
Feb 03 21:48:52 localhost.localdomain kernel: audit: type=1404 audit(1423000132.274:2): enforcing=1 old_en
Feb 03 21:48:52 localhost.localdomain kernel: SELinux: 2048 avtab hash slots, 104131 rules.
Feb 03 21:48:52 localhost.localdomain kernel: input: ImExPS/2 Generic Explorer Mouse as /devices/platform/
Feb 03 21:48:52 localhost.localdomain kernel: SELinux: 8 users, 102 roles, 4976 types, 294 bools, 1 sens,
Feb 03 21:48:52 localhost.localdomain kernel: SELinux: 83 classes, 104131 rules

. . .
You will likely have pages and pages of data to scroll through, which can be tens or hundreds of thousands of lines long if systemd has been on your system for a long while. This demonstrates how much data is available in the journal database.

The format will be familiar to those who are used to standard syslog logging. However, this actually collects data from more sources than traditional syslog implementations are capable of. It includes logs from the early boot process, the kernel, the initrd, and application standard error and out. These are all available in the journal.

You may notice that all of the timestamps being displayed are local time. This is available for every log entry now that we have our local time set correctly on our system. All of the logs are displayed using this new information.

If you want to display the timestamps in UTC, you can use the --utc flag:
journalctl --utc


Journal Filtering by Time

While having access to such a large collection of data is definitely useful, such a large amount of information can be difficult or impossible to inspect and process mentally. Because of this, one of the most important features of journalctl is its filtering options.


Displaying Logs from the Current Boot

The most basic of these which you might use daily, is the -b flag. This will show you all of the journal entries that have been collected since the most recent reboot.
journalctl -b

This will help you identify and manage information that is pertinent to your current environment.

In cases where you aren't using this feature and are displaying more than one day of boots, you will see that journalctl has inserted a line that looks like this whenever the system went down:
. . .

-- Reboot --

. . .
This can be used to help you logically separate the information into boot sessions.


Past Boots

While you will commonly want to display the information from the current boot, there are certainly times when past boots would be helpful as well. The journal can save information from many previous boots, sojournalctl can be made to display information easily.

Some distributions enable saving previous boot information by default, while others disable this feature. To enable persistent boot information, you can either create the directory to store the journal by typing:

  • sudo mkdir -p /var/log/journal


Or you can edit the journal configuration file:

  • sudo nano /etc/systemd/journald.conf


Under the [Journal] section, set the Storage= option to "persistent" to enable persistent logging:
/etc/systemd/journald.conf
. . .
[Journal]
Storage=persistent

When saving previous boots is enabled on your server, journalctl provides some commands to help you work with boots as a unit of division. To see the boots that journald knows about, use the --list-boots option with journalctl:
journalctl --list-boots
-2 caf0524a1d394ce0bdbcff75b94444fe Tue 2015-02-03 21:48:52 UTC—Tue 2015-02-03 22:17:00 UTC
-1 13883d180dc0420db0abcb5fa26d6198 Tue 2015-02-03 22:17:03 UTC—Tue 2015-02-03 22:19:08 UTC
0 bed718b17a73415fade0e4e7f4bea609 Tue 2015-02-03 22:19:12 UTC—Tue 2015-02-03 23:01:01 UTC

This will display a line for each boot. The first column is the offset for the boot that can be used to easily reference the boot with journalctl. If you need an absolute reference, the boot ID is in the second column. You can tell the time that the boot session refers to with the two time specifications listed towards the end.

To display information from these boots, you can use information from either the first or second column.

For instance, to see the journal from the previous boot, use the -1 relative pointer with the -b flag:
journalctl -b -1

You can also use the boot ID to call back the data from a boot:
journalctl -b caf0524a1d394ce0bdbcff75b94444fe


Time Windows

While seeing log entries by boot is incredibly useful, often you may wish to request windows of time that do not align well with system boots. This may be especially true when dealing with long-running servers with significant uptime.

You can filter by arbitrary time limits using the --since and --until options, which restrict the entries displayed to those after or before the given time, respectively.

The time values can come in a variety of formats. For absolute time values, you should use the following format:
YYYY-MM-DD HH:MM:SS

For instance, we can see all of the entries since January 10th, 2015 at 5:15 PM by typing:
journalctl --since "2015-01-10 17:15:00"

If components of the above format are left off, some defaults will be applied. For instance, if the date is omitted, the current date will be assumed. If the time component is missing, "00:00:00" (midnight) will be substituted. The seconds field can be left off as well to default to "00":
journalctl --since "2015-01-10" --until "2015-01-11 03:00"

The journal also understands some relative values and named shortcuts. For instance, you can use the words "yesterday", "today", "tomorrow", or "now". You do relative times by prepending "-" or "+" to a numbered value or using words like "ago" in a sentence construction.

To get the data from yesterday, you could type:
journalctl --since yesterday

If you received reports of a service interruption starting at 9:00 AM and continuing until an hour ago, you could type:
journalctl --since 09:00 --until "1 hour ago"

As you can see, it's relatively easy to define flexible windows of time to filter the entries you wish to see.


Filtering by Message Interest

We learned above some ways that you can filter the journal data using time constraints. In this section we'll discuss how to filter based on what service or component you are interested in. The systemd journal provides a variety of ways of doing this.


By Unit

Perhaps the most useful way of filtering is by the unit you are interested in. We can use the -u option to filter in this way.

For instance, to see all of the logs from an Nginx unit on our system, we can type:
journalctl -u nginx.service

Typically, you would probably want to filter by time as well in order to display the lines you are interested in. For instance, to check on how the service is running today, you can type:
journalctl -u nginx.service --since today

This type of focus becomes extremely helpful when you take advantage of the journal's ability to interleave records from various units. For instance, if your Nginx process is connected to a PHP-FPM unit to process dynamic content, you can merge the entries from both in chronological order by specifying both units:
journalctl -u nginx.service -u php-fpm.service --since today

This can make it much easier to spot the interactions between different programs and debug systems instead of individual processes.


By Process, User, or Group ID

Some services spawn a variety of child processes to do work. If you have scouted out the exact PID of the process you are interested in, you can filter by that as well.

To do this we can filter by specifying the _PID field. For instance if the PID we're interested in is 8088, we could type:
journalctl _PID=8088

At other times, you may wish to show all of the entries logged from a specific user or group. This can be done with the _UID or _GID filters. For instance, if your web server runs under the www-data user, you can find the user ID by typing:
id -u www-data
33

Afterwards, you can use the ID that was returned to filter the journal results:
journalctl _UID=33 --since today

The systemd journal has many fields that can be used for filtering. Some of those are passed from the process being logged and some are applied by journald using information it gathers from the system at the time of the log.

The leading underscore indicates that the _PID field is of the latter type. The journal automatically records and indexes the PID of the process that is logging for later filtering. You can find out about all of the available journal fields by typing:
man systemd.journal-fields

We will be discussing some of these in this guide. For now though, we will go over one more useful option having to do with filtering by these fields. The -F option can be used to show all of the available values for a given journal field.

For instance, to see which group IDs the systemd journal has entries for, you can type:
journalctl -F _GID
32
99
102
133
81
84
100
0
124
87

This will show you all of the values that the journal has stored for the group ID field. This can help you construct your filters.


By Component Path

We can also filter by providing a path location.

If the path leads to an executable, journalctl will display all of the entries that involve the executable in question. For instance, to find those entries that involve the bash executable, you can type:
journalctl /usr/bin/bash

Usually, if a unit is available for the executable, that method is cleaner and provides better info (entries from associated child processes, etc). Sometimes, however, this is not possible.


Displaying Kernel Messages

Kernel messages, those usually found in dmesg output, can be retrieved from the journal as well.

To display only these messages, we can add the -k or --dmesg flags to our command:
journalctl -k

By default, this will display the kernel messages from the current boot. You can specify an alternative boot using the normal boot selection flags discussed previously. For instance, to get the messages from five boots ago, you could type:
journalctl -k -b -5


By Priority

One filter that system administrators often are interested in is the message priority. While it is often useful to log information at a very verbose level, when actually digesting the available information, low priority logs can be distracting and confusing.

You can use journalctl to display only messages of a specified priority or above by using the -poption. This allows you to filter out lower priority messages.

For instance, to show only entries logged at the error level or above, you can type:
journalctl -p err -b

This will show you all messages marked as error, critical, alert, or emergency. The journal implements the standard syslog message levels. You can use either the priority name or its corresponding numeric value. In order of highest to lowest priority, these are:
  • 0: emerg
  • 1: alert
  • 2: crit
  • 3: err
  • 4: warning
  • 5: notice
  • 6: info
  • 7: debug
The above numbers or names can be used interchangeably with the -p option. Selecting a priority will display messages marked at the specified level and those above it.


Modifying the Journal Display

Above, we demonstrated entry selection through filtering. There are other ways we can modify the output though. We can adjust the journalctl display to fit various needs.


Truncate or Expand Output

We can adjust how journalctl displays data by telling it to shrink or expand the output.

By default, journalctl will show the entire entry in the pager, allowing the entries to trail off to the right of the screen. This info can be accessed by pressing the right arrow key.

If you'd rather have the output truncated, inserting an ellipsis where information has been removed, you can use the --no-full option:
journalctl --no-full
. . .

Feb 04 20:54:13 journalme sshd[937]: Failed password for root from 83.234.207.60...h2
Feb 04 20:54:13 journalme sshd[937]: Connection closed by 83.234.207.60 [preauth]
Feb 04 20:54:13 journalme sshd[937]: PAM 2 more authentication failures; logname...ot

You can also go in the opposite direction with this and tell journalctl to display all of its information, regardless of whether it includes unprintable characters. We can do this with the -a flag:
journalctl -a


Output to Standard Out

By default, journalctl displays output in a pager for easier consumption. If you are planning on processing the data with text manipulation tools, however, you probably want to be able to output to standard output.
You can do this with the --no-pager option:
journalclt --no-pager
This can be piped immediately into a processing utility or redirected into a file on disk, depending on your needs.


Output Formats

If you are processing journal entries, as mentioned above, you most likely will have an easier time parsing the data if it is in a more consumable format. Luckily, the journal can be displayed in a variety of formats as needed. You can do this using the -o option with a format specifier.

For instance, you can output the journal entries in JSON by typing:
journalctl -b -u nginx -o json
{ "__CURSOR" : "s=13a21661cf4948289c63075db6c25c00;i=116f1;b=81b58db8fd9046ab9f847ddb82a2fa2d;m=19f0daa;t=50e33c33587ae;x=e307daadb4858635", "__REALTIME_TIMESTAMP" : "1422990364739502", "__MONOTONIC_TIMESTAMP" : "27200938", "_BOOT_ID" : "81b58db8fd9046ab9f847ddb82a2fa2d", "PRIORITY" : "6", "_UID" : "0", "_GID" : "0", "_CAP_EFFECTIVE" : "3fffffffff", "_MACHINE_ID" : "752737531a9d1a9c1e3cb52a4ab967ee", "_HOSTNAME" : "desktop", "SYSLOG_FACILITY" : "3", "CODE_FILE" : "src/core/unit.c", "CODE_LINE" : "1402", "CODE_FUNCTION" : "unit_status_log_starting_stopping_reloading", "SYSLOG_IDENTIFIER" : "systemd", "MESSAGE_ID" : "7d4958e842da4a758f6c1cdc7b36dcc5", "_TRANSPORT" : "journal", "_PID" : "1", "_COMM" : "systemd", "_EXE" : "/usr/lib/systemd/systemd", "_CMDLINE" : "/usr/lib/systemd/systemd", "_SYSTEMD_CGROUP" : "/", "UNIT" : "nginx.service", "MESSAGE" : "Starting A high performance web server and a reverse proxy server...", "_SOURCE_REALTIME_TIMESTAMP" : "1422990364737973" }

. . .
This is useful for parsing with utilities. You could use the json-pretty format to get a better handle on the data structure before passing it off to the JSON consumer:
journalctl -b -u nginx -o json-pretty
{
"__CURSOR" : "s=13a21661cf4948289c63075db6c25c00;i=116f1;b=81b58db8fd9046ab9f847ddb82a2fa2d;m=19f0daa;t=50e33c33587ae;x=e307daadb4858635",
"__REALTIME_TIMESTAMP" : "1422990364739502",
"__MONOTONIC_TIMESTAMP" : "27200938",
"_BOOT_ID" : "81b58db8fd9046ab9f847ddb82a2fa2d",
"PRIORITY" : "6",
"_UID" : "0",
"_GID" : "0",
"_CAP_EFFECTIVE" : "3fffffffff",
"_MACHINE_ID" : "752737531a9d1a9c1e3cb52a4ab967ee",
"_HOSTNAME" : "desktop",
"SYSLOG_FACILITY" : "3",
"CODE_FILE" : "src/core/unit.c",
"CODE_LINE" : "1402",
"CODE_FUNCTION" : "unit_status_log_starting_stopping_reloading",
"SYSLOG_IDENTIFIER" : "systemd",
"MESSAGE_ID" : "7d4958e842da4a758f6c1cdc7b36dcc5",
"_TRANSPORT" : "journal",
"_PID" : "1",
"_COMM" : "systemd",
"_EXE" : "/usr/lib/systemd/systemd",
"_CMDLINE" : "/usr/lib/systemd/systemd",
"_SYSTEMD_CGROUP" : "/",
"UNIT" : "nginx.service",
"MESSAGE" : "Starting A high performance web server and a reverse proxy server...",
"_SOURCE_REALTIME_TIMESTAMP" : "1422990364737973"
}

. . .
The following formats can be used for display:
  • cat: Displays only the message field itself.
  • export: A binary format suitable for transferring or backing up.
  • json: Standard JSON with one entry per line.
  • json-pretty: JSON formatted for better human-readability
  • json-sse: JSON formatted output wrapped to make add server-sent event compatible
  • short: The default syslog style output
  • short-iso: The default format augmented to show ISO 8601 wallclock timestamps.
  • short-monotonic: The default format with monotonic timestamps.
  • short-precise: The default format with microsecond precision
  • verbose: Shows every journal field available for the entry, including those usually hidden internally.
These options allow you to display the journal entries in the whatever format best suits your current needs.


Active Process Monitoring

The journalctl command imitates how many administrators use tail for monitoring active or recent activity. This functionality is built into journalctl, allowing you to access these features without having to pipe to another tool.


Displaying Recent Logs

To display a set amount of records, you can use the -n option, which works exactly as tail -n.
By default, it will display the most recent 10 entries:
journalctl -n

You can specify the number of entries you'd like to see with a number after the -n:
journalctl -n 20


Following Logs

To actively follow the logs as they are being written, you can use the -f flag. Again, this works as you might expect if you have experience using tail -f:
journalctl -f


Journal Maintenance

You may be wondering about the cost is of storing all of the data we've seen so far. Furthermore, you may be interesting in cleaning up some older logs and freeing up space.


Finding Current Disk Usage

You can find out the amount of space that the journal is currently occupying on disk by using the --disk-usage flag:
journalctl --disk-usage
Journals take up 8.0M on disk.


Deleting Old Logs

If you wish to shrink your journal, you can do that in two different ways (available with systemd version 218 and later).

If you use the --vacuum-size option, you can shrink your journal by indicating a size. This will remove old entries until the total journal space taken up on disk is at the requested size:
sudo journalctl --vacuum-size=1G

Another way that you can shrink the journal is providing a cutoff time with the --vacuum-time option. Any entries beyond that time are deleted. This allows you to keep the entries that have been created after a specific time.

For instance, to keep entries from the last year, you can type:
sudo journalctl --vacuum-time=1years


Limiting Journal Expansion

You can configure your server to place limits on how much space the journal can take up. This can be done by editing the /etc/systemd/journald.conf file.

The following items can be used to limit the journal growth:
  • SystemMaxUse=: Specifies the maximum disk space that can be used by the journal in persistent storage.
  • SystemKeepFree=: Specifies the amount of space that the journal should leave free when adding journal entries to persistent storage.
  • SystemMaxFileSize=: Controls how large individual journal files can grow to in persistent storage before being rotated.
  • RuntimeMaxUse=: Specifies the maximum disk space that can be used in volatile storage (within the/run filesystem).
  • RuntimeKeepFree=: Specifies the amount of space to be set aside for other uses when writing data to volatile storage (within the /run filesystem).
  • RuntimeMaxFileSize=: Specifies the amount of space that an individual journal file can take up in volatile storage (within the /run filesystem) before being rotated.
By setting these values, you can control how journald consumes and preserves space on your server.


Conclusion

As you can see, the systemd journal is incredibly useful for collecting and managing your system and application data. Most of the flexibility comes from the extensive metadata automatically recorded and the centralized nature of the log. The journalctl command makes it easy to take advantage of the advanced features of the journal and to do extensive analysis and relational debugging of different application components.

Understanding Systemd Units and Unit Files


Introduction

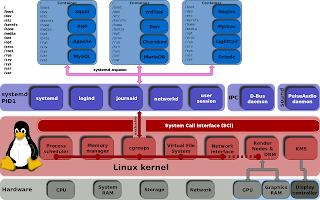
Increasingly, Linux distributions are adopting or planning to adopt the systemd init system. This powerful suite of software can manage many aspects of your server, from services to mounted devices and system states.

In systemd, a unit refers to any resource that the system knows how to operate on and manage. This is the primary object that the systemd tools know how to deal with. These resources are defined using configuration files called unit files.

In this guide, we will introduce you to the different units that systemd can handle. We will also be covering some of the many directives that can be used in unit files in order to shape the way these resources are handled on your system.

What do Systemd Units Give You?

Units are the objects that systemd knows how to manage. These are basically a standardized representation of system resources that can be managed by the suite of daemons and manipulated by the provided utilities.

Units in some ways can be said to similar to services or jobs in other init systems. However, a unit has a much broader definition, as these can be used to abstract services, network resources, devices, filesystem mounts, and isolated resource pools.

Ideas that in other init systems may be handled with one unified service definition can be broken out into component units according to their focus. This organizes by function and allows you to easily enable, disable, or extend functionality without modifying the core behavior of a unit.

Some features that units are able implement easily are:
  • socket-based activation: Sockets associated with a service are best broken out of the daemon itself in order to be handled separately. This provides a number of advantages, such as delaying the start of a service until the associated socket is first accessed. This also allows the system to create all sockets early in the boot process, making it possible to boot the associated services in parallel.
  • bus-based activation: Units can also be activated on the bus interface provided by D-Bus. A unit can be started when an associated bus is published.
  • path-based activation: A unit can be started based on activity on or the availability of certain filesystem paths. This utilizes inotify.
  • device-based activation: Units can also be started at the first availability of associated hardware by leveraging udev events.
  • implicit dependency mapping: Most of the dependency tree for units can be built by systemd itself. You can still add dependency and ordering information, but most of the heavy lifting is taken care of for you.
  • instances and templates: Template unit files can be used to create multiple instances of the same general unit. This allows for slight variations or sibling units that all provide the same general function.
  • easy security hardening: Units can implement some fairly good security features by adding simple directives. For example, you can specify no or read-only access to part of the filesystem, limit kernel capabilities, and assign private /tmp and network access.
  • drop-ins and snippets: Units can easily be extended by providing snippets that will override parts of the system's unit file. This makes it easy to switch between vanilla and customized unit implementations.
There are many other advantages that systemd units have over other init systems' work items, but this should give you an idea of the power that can be leveraged using native configuration directives.


Where are Systemd Unit Files Found?

The files that define how systemd will handle a unit can be found in many different locations, each of which have different priorities and implications.

The system's copy of unit files are generally kept in the /lib/systemd/system directory. When software installs unit files on the system, this is the location where they are placed by default.

Unit files stored here are able to be started and stopped on-demand during a session. This will be the generic, vanilla unit file, often written by the upstream project's maintainers that should work on any system that deploys systemd in its standard implementation. You should not edit files in this directory. Instead you should override the file, if necessary, using another unit file location which will supersede the file in this location.

If you wish to modify the way that a unit functions, the best location to do so is within the/etc/systemd/system directory. Unit files found in this directory location take precedence over any of the other locations on the filesystem. If you need to modify the system's copy of a unit file, putting a replacement in this directory is the safest and most flexible way to do this.

If you wish to override only specific directives from the system's unit file, you can actually provide unit file snippets within a subdirectory. These will append or modify the directives of the system's copy, allowing you to specify only the options you want to change.

The correct way to do this is to create a directory named after the unit file with .d appended on the end. So for a unit called example.service, a subdirectory called example.service.d could be created. Within this directory a file ending with .conf can be used to override or extend the attributes of the system's unit file.

There is also a location for run-time unit definitions at /run/systemd/system. Unit files found in this directory have a priority landing between those in /etc/systemd/system and /lib/systemd/system. Files in this location are given less weight than the former location, but more weight than the latter.

The systemd process itself uses this location for dynamically created unit files created at runtime. This directory can be used to change the system's unit behavior for the duration of the session. All changes made in this directory will be lost when the server is rebooted.


Types of Units

Systemd categories units according to the type of resource they describe. The easiest way to determine the type of a unit is with its type suffix, which is appended to the end of the resource name. The following list describes the types of units available to systemd:

.service: A service unit describes how to manage a service or application on the server. This will include how to start or stop the service, under which circumstances it should be automatically started, and the dependency and ordering information for related software.

.socket: A socket unit file describes a network or IPC socket, or a FIFO buffer that systemd uses for socket-based activation. These always have an associated .service file that will be started when activity is seen on the socket that this unit defines.

.device: A unit that describes a device that has been designated as needing systemd management byudev or the sysfs filesystem. Not all devices will have .device files. Some scenarios where .deviceunits may be necessary are for ordering, mounting, and accessing the devices.

.mount: This unit defines a mountpoint on the system to be managed by systemd. These are named after the mount path, with slashes changed to dashes. Entries within /etc/fstab can have units created automatically.

.automount: An .automount unit configures a mountpoint that will be automatically mounted. These must be named after the mount point they refer to and must have a matching .mount unit to define the specifics of the mount.

.swap: This unit describes swap space on the system. The name of these units must reflect the device or file path of the space.

.target: A target unit is used to provide synchronization points for other units when booting up or changing states. They also can be used to bring the system to a new state. Other units specify their relation to targets to become tied to the target's operations.

.path: This unit defines a path that can be used for path-based activation. By default, a .service unit of the same base name will be started when the path reaches the specified state. This uses inotify to monitor the path for changes.

.timer: A .timer unit defines a timer that will be managed by systemd, similar to a cron job for delayed or scheduled activation. A matching unit will be started when the timer is reached.

.snapshot: A .snapshot unit is created automatically by the systemctl snapshot command. It allows you to reconstruct the current state of the system after making changes. Snapshots do not survive across sessions and are used to roll back temporary states.

.slice: A .slice unit is associated with Linux Control Group nodes, allowing resources to be restricted or assigned to any processes associated with the slice. The name reflects its hierarchical position within the cgroup tree. Units are placed in certain slices by default depending on their type.

.scope: Scope units are created automatically by systemd from information received from its bus interfaces. These are used to manage sets of system processes that are created externally.

As you can see, there are many different units that systemd knows how to manage. Many of the unit types work together to add functionality. For instance, some units are used to trigger other units and provide activation functionality.

We will mainly be focusing on .service units due to their utility and the consistency in which administrators need to managed these units.


Anatomy of a Unit File

The internal structure of unit files are organized with sections. Sections are denoted by a pair of square brackets "[" and "]" with the section name enclosed within. Each section extends until the beginning of the subsequent section or until the end of the file.


General Characteristics of Unit Files

Section names are well defined and case-sensitive. So, the section [Unit] will not be interpreted correctly if it is spelled like [UNIT]. If you need to add non-standard sections to be parsed by applications other than systemd, you can add a X- prefix to the section name.

Within these sections, unit behavior and metadata is defined through the use of simple directives using a key-value format with assignment indicated by an equal sign, like this:
[Section]
Directive1=value
Directive2=value

. . .

In the event of an override file (such as those contained in a unit.type.d directory), directives can be reset by assigning them to an empty string. For example, the system's copy of a unit file may contain a directive set to a value like this:
Directive1=default_value

The default_value can be eliminated in an override file by referencing Directive1 without a value, like this:
Directive1=

In general, systemd allows for easy and flexible configuration. For example, multiple boolean expressions are accepted (1yeson, and true for affirmative and 0no off, and false for the opposite answer). Times can be intelligently parsed, with seconds assumed for unit-less values and combining multiple formats accomplished internally.

[Unit] Section Directives

The first section found in most unit files is the [Unit] section. This is generally used for defining metadata for the unit and configuring the relationship of the unit to other units.

Although section order does not matter to systemd when parsing the file, this section is often placed at the top because it provides an overview of the unit. Some common directives that you will find in the[Unit] section are:
  • Description=: This directive can be used to describe the name and basic functionality of the unit. It is returned by various systemd tools, so it is good to set this to something short, specific, and informative.
  • Documentation=: This directive provides a location for a list of URIs for documentation. These can be either internally available man pages or web accessible URLs. The systemctl status command will expose this information, allowing for easy discoverability.
  • Requires=: This directive lists any units upon which this unit essentially depends. If the current unit is activated, the units listed here must successfully activate as well, else this unit will fail. These units are started in parallel with the current unit by default.
  • Wants=: This directive is similar to Requires=, but less strict. Systemd will attempt to start any units listed here when this unit is activated. If these units are not found or fail to start, the current unit will continue to function. This is the recommended way to configure most dependency relationships. Again, this implies a parallel activation unless modified by other directives.
  • BindsTo=: This directive is similar to Requires=, but also causes the current unit to stop when the associated unit terminates.
  • Before=: The units listed in this directive will not be started until the current unit is marked as started if they are activated at the same time. This does not imply a dependency relationship and must be used in conjunction with one of the above directives if this is desired.
  • After=: The units listed in this directive will be started before starting the current unit. This does not imply a dependency relationship and one must be established through the above directives if this is required.
  • Conflicts=: This can be used to list units that cannot be run at the same time as the current unit. Starting a unit with this relationship will cause the other units to be stopped.
  • Condition...=: There are a number of directives that start with Condition which allow the administrator to test certain conditions prior to starting the unit. This can be used to provide a generic unit file that will only be run when on appropriate systems. If the condition is not met, the unit is gracefully skipped.
  • Assert...=: Similar to the directives that start with Condition, these directives check for different aspects of the running environment to decide whether the unit should activate. However, unlike theCondition directives, a negative result causes a failure with this directive.
Using these directives and a handful of others, general information about the unit and its relationship to other units and the operating system can be established.

[Install] Section Directives

On the opposite side of unit file, the last section is often the [Install] section. This section is optional and is used to define the behavior or a unit if it is enabled or disabled. Enabling a unit marks it to be automatically started at boot. In essence, this is accomplished by latching the unit in question onto another unit that is somewhere in the line of units to be started at boot.

Because of this, only units that can be enabled will have this section. The directives within dictate what should happen when the unit is enabled:
  • WantedBy=: The WantedBy= directive is the most common way to specify how a unit should be enabled. This directive allows you to specify a dependency relationship in a similar way to theWants= directive does in the [Unit] section. The difference is that this directive is included in the ancillary unit allowing the primary unit listed to remain relatively clean. When a unit with this directive is enabled, a directory will be created within /etc/systemd/system named after the specified unit with .wants appended to the end. Within this, a symbolic link to the current unit will be created, creating the dependency. For instance, if the current unit has WantedBy=multi-user.target, a directory called multi-user.target.wants will be created within /etc/systemd/system (if not already available) and a symbolic link to the current unit will be placed within. Disabling this unit removes the link and removes the dependency relationship.
  • RequiredBy=: This directive is very similar to the WantedBy= directive, but instead specifies a required dependency that will cause the activation to fail if not met. When enabled, a unit with this directive will create a directory ending with .requires.
  • Alias=: This directive allows the unit to be enabled under another name as well. Among other uses, this allows multiple providers of a function to be available, so that related units can look for any provider of the common aliased name.
  • Also=: This directive allows units to be enabled or disabled as a set. Supporting units that should always be available when this unit is active can be listed here. They will be managed as a group for installation tasks.
  • DefaultInstance=: For template units (covered later) which can produce unit instances with unpredictable names, this can be used as a fallback value for the name if an appropriate name is not provided.


Unit-Specific Section Directives

Sandwiched between the previous two sections, you will likely find unit type-specific sections. Most unit types offer directives that only apply to their specific type. These are available within sections named after their type. We will cover those briefly here.

The devicetargetsnapshot, and scope unit types have no unit-specific directives, and thus have no associated sections for their type.

The [Service] Section

The [Service] section is used to provide configuration that is only applicable for services.

One of the basic things that should be specified within the [Service] section is the Type= of the service. This categorizes services by their process and daemonizing behavior. This is important because it tellssystemd how to correctly manage the servie and find out its state.

The Type= directive can be one of the following:
  • simple: The main process of the service is specified in the start line. This is the default if the Type=and Busname= directives are not set, but the ExecStart= is set. Any communication should be handled outside of the unit through a second unit of the appropriate type (like through a .socketunit if this unit must communicate using sockets).
  • forking: This service type is used when the service forks a child process, exiting the parent process almost immediately. This tells systemd that the process is still running even though the parent exited.
  • oneshot: This type indicates that the process will be short-lived and that systemd should wait for the process to exit before continuing on with other units. This is the default Type= and ExecStart= are not set. It is used for one-off tasks.
  • dbus: This indicates that unit will take a name on the D-Bus bus. When this happens, systemd will continue to process the next unit.
  • notify: This indicates that the service will issue a notification when it has finished starting up. Thesystemd process will wait for this to happen before proceeding to other units.
  • idle: This indicates that the service will not be run until all jobs are dispatched.
Some additional directives may be needed when using certain service types. For instance:
  • RemainAfterExit=: This directive is commonly used with the oneshot type. It indicates that the service should be considered active even after the process exits.
  • PIDFile=: If the service type is marked as "forking", this directive is used to set the path of the file that should contain the process ID number of the main child that should be monitored.
  • BusName=: This directive should be set to the D-Bus bus name that the service will attempt to acquire when using the "dbus" service type.
  • NotifyAccess=: This specifies access to the socket that should be used to listen for notifications when the "notify" service type is selected This can be "none", "main", or "all. The default, "none", ignores all status messages. The "main" option will listen to messages from the main process and the "all" option will cause all members of the service's control group to be processed.
So far, we have discussed some pre-requisite information, but we haven't actually defined how to manage our services. The directives to do this are:
  • ExecStart=: This specifies the full path and the arguments of the command to be executed to start the process. This may only be specified once (except for "oneshot" services). If the path to the command is preceded by a dash "-" character, non-zero exit statuses will be accepted without marking the unit activation as failed.
  • ExecStartPre=: This can be used to provide additional commands that should be executed before the main process is started. This can be used multiple times. Again, commands must specify a full path and they can be preceded by "-" to indicate that the failure of the command will be tolerated.
  • ExecStartPost=: This has the same exact qualities as ExecStartPre= except that it specifies commands that will be run after the main process is started.
  • ExecReload=: This optional directive indicates the command necessary to reload the configuration of the service if available.
  • ExecStop=: This indicates the command needed to stop the service. If this is not given, the process will be killed immediately when the service is stopped.
  • ExecStopPost=: This can be used to specify commands to execute following the stop command.
  • RestartSec=: If automatically restarting the service is enabled, this specifies the amount of time to wait before attempting to restart the service.
  • Restart=: This indicates the circumstances under which systemd will attempt to automatically restart the service. This can be set to values like "always", "on-success", "on-failure", "on-abnormal", "on-abort", or "on-watchdog". These will trigger a restart according to the way that the service was stopped.
  • TimeoutSec=: This configures the amount of time that systemd will wait when stopping or stopping the service before marking it as failed or forcefully killing it. You can set separate timeouts withTimeoutStartSec= and TimeoutStopSec= as well.

The [Socket] Section

Socket units are very common in systemd configurations because many services implement socket-based activation to provide better parallelization and flexibility. Each socket unit must have a matching service unit that will be activated when the socket receives activity.

By breaking socket control outside of the service itself, sockets can be initialized early and the associated services can often be started in parallel. By default, the socket name will attempt to start the service of the same name upon receiving a connection. When the service is initialized, the socket will be passed to it, allowing it to begin processing any buffered requests.

To specify the actual socket, these directives are common:
  • ListenStream=: This defines an address for a stream socket which supports sequential, reliable communication. Services that use TCP should use this socket type.
  • ListenDatagram=: This defines an address for a datagram socket which supports fast, unreliable communication packets. Services that use UDP should set this socket type.
  • ListenSequentialPacket=: This defines an address for sequential, reliable communication with max length datagrams that preserves message boundaries. This is found most often for Unix sockets.
  • ListenFIFO: Along with the other listening types, you can also specify a FIFO buffer instead of a socket.
There are more types of listening directives, but the ones above are the most common.
Other characteristics of the sockets can be controlled through additional directives:
  • Accept=: This determines whether an additional instance of the service will be started for each connection. If set to false (the default), one instance will handle all connections.
  • SocketUser=: With a Unix socket, specifies the owner of the socket. This will be the root user if left unset.
  • SocketGroup=: With a Unix socket, specifies the group owner of the socket. This will be the root group if neither this or the above are set. If only the SocketUser= is set, systemd will try to find a matching group.
  • SocketMode=: For Unix sockets or FIFO buffers, this sets the permissions on the created entity.
  • Service=: If the service name does not match the .socket name, the service can be specified with this directive.

The [Mount] Section

Mount units allow for mount point management from within systemd. Mount points are named after the directory that they control, with a translation algorithm applied.

For example, the leading slash is removed, all other slashes are translated into dashes "-", and all dashes and unprintable characters are replaced with C-style escape codes. The result of this translation is used as the mount unit name. Mount units will have an implicit dependency on other mounts above it in the hierarchy.

Mount units are often translated directly from /etc/fstab files during the boot process. For the unit definitions automatically created and those that you wish to define in a unit file, the following directives are useful:
  • What=: The absolute path to the resource that needs to be mounted.
  • Where=: The absolute path of the mount point where the resource should be mounted. This should be the same as the unit file name, except using conventional filesystem notation.
  • Type=: The filesystem type of the mount.
  • Options=: Any mount options that need to be applied. This is a comma-separated list.
  • SloppyOptions=: A boolean that determines whether the mount will fail if there is an unrecognized mount option.
  • DirectoryMode=: If parent directories need to be created for the mount point, this determines the permission mode of these directories.
  • TimeoutSec=: Configures the amount of time the system will wait until the mount operation is marked as failed.

The [Automount] Section

This unit allows an associated .mount unit to be automatically mounted at boot. As with the .mount unit, these units must be named after the translated mount point's path.

The [Automount] section is pretty simple, with only the following two options allowed:
  • Where=: The absolute path of the automount point on the filesystem. This will match the filename except that it uses conventional path notation instead of the translation.
  • DirectoryMode=: If the automount point or any parent directories need to be created, this will determine the permissions settings of those path components.

The [Swap] Section

Swap units are used to configure swap space on the system. The units must be named after the swap file or the swap device, using the same filesystem translation that was discussed above.
Like the mount options, the swap units can be automatically created from /etc/fstab entries, or can be configured through a dedicated unit file.

The [Swap] section of a unit file can contain the following directives for configuration:
  • What=: The absolute path to the location of the swap space, whether this is a file or a device.
  • Priority=: This takes an integer that indicates the priority of the swap being configured.
  • Options=: Any options that are typically set in the /etc/fstab file can be set with this directive instead. A comma-separated list is used.
  • TimeoutSec=: The amount of time that systemd waits for the swap to be activated before marking the operation as a failure.

The [Path] Section

A path unit defines a filesystem path that systmed can monitor for changes. Another unit must exist that will be be activated when certain activity is detected at the path location. Path activity is determined thorugh inotify events.

The [Path] section of a unit file can contain the following directives:
  • PathExists=: This directive is used to check whether the path in question exists. If it does, the associated unit is activated.
  • PathExistsGlob=: This is the same as the above, but supports file glob expressions for determining path existence.
  • PathChanged=: This watches the path location for changes. The associated unit is activated if a change is detected when the watched file is closed.
  • PathModified=: This watches for changes like the above directive, but it activates on file writes as well as when the file is closed.
  • DirectoryNotEmpty=: This directive allows systemd to activate the associated unit when the directory is no longer empty.
  • Unit=: This specifies the unit to activate when the path conditions specified above are met. If this is omitted, systemd will look for a .service file that shares the same base unit name as this unit.
  • MakeDirectory=: This determines if systemd will create the directory structure of the path in question prior to watching.
  • DirectoryMode=: If the above is enabled, this will set the permission mode of any path components that must be created.

The [Timer] Section

Timer units are used to schedule tasks to operate at a specific time or after a certain delay. This unit type replaces or supplements some of the functionality of the cron and at daemons. An associated unit must be provided which will be activated when the timer is reached.

The [Timer] section of a unit file can contain some of the following directives:
  • OnActiveSec=: This directive allows the associated unit to be activated relative to the .timer unit's activation.
  • OnBootSec=: This directive is used to specify the amount of time after the system is booted when the associated unit should be activated.
  • OnStartupSec=: This directive is similar to the above timer, but in relation to when the systemdprocess itself was started.
  • OnUnitActiveSec=: This sets a timer according to when the associated unit was last activated.
  • OnUnitInactiveSec=: This sets the timer in relation to when the associated unit was last marked as inactive.
  • OnCalendar=: This allows you to activate the associated unit by specifying an absolute instead of relative to an event.
  • AccuracySec=: This unit is used to set the level of accuracy with which the timer should be adhered to. By default, the associated unit will be activated within one minute of the timer being reached. The value of this directive will determine the upper bounds on the window in which systemd schedules the activation to occur.
  • Unit=: This directive is used to specify the unit that should be activated when the timer elapses. If unset, systemd will look for a .service unit with a name that matches this unit.
  • Persistent=: If this is set, systemd will trigger the associated unit when the timer becomes active if it would have been triggered during the period in which the timer was inactive.
  • WakeSystem=: Setting this directive allows you to wake a system from suspend if the timer is reached when in that state.

The [Slice] Section

The [Slice] section of a unit file actually does not have any .slice unit specific configuration. Instead, it can contain some resource management directives that are actually available to a number of the units listed above.

Some common directives in the [Slice] section, which may also be used in other units can be found in the systemd.resource-control man page. These are valid in the following unit-specific sections:
  • [Slice]
  • [Scope]
  • [Service]
  • [Socket]
  • [Mount]
  • [Swap]


Creating Instance Units from Template Unit Files

We mentioned earlier in this guide the idea of template unit files being used to create multiple instances of units. In this section, we can go over this concept in more detail.

Template unit files are, in most ways, no different than regular unit files. However, these provide flexibility in configuring units by allowing certain parts of the file to utilize dynamic information that will be available at runtime.


Template and Instance Unit Names

Template unit files can be identified because they contain an @ symbol after the base unit name and before the unit type suffix. A template unit file name may look like this:
example@.service

When an instance is created from a template, an instance identifier is placed between the @ symbol and the period signifying the start of the unit type. For example, the above template unit file could be used to create an instance unit that looks like this:
example@instance1.service

An instance file is usually created as a symbolic link to the template file, with the link name including the instance identifier. In this way, multiple links with unique identifiers can point back to a single template file. When managing an instance unit, systemd will look for a file with the exact instance name you specify on the command line to use. If it cannot find one, it will look for an associated template file.


Template Specifiers

The power of template unit files is mainly seen through its ability to dynamically substitute appropriate information within the unit definition according to the operating environment. This is done by setting the directives in the template file as normal, but replacing certain values or parts of values with variable specifiers.

The following are some of the more common specifiers will be replaced when an instance unit is interpreted with the relevant information:
  • %n: Anywhere where this appears in a template file, the full resulting unit name will be inserted.
  • %N: This is the same as the above, but any escaping, such as those present in file path patterns, will be reversed.
  • %p: This references the unit name prefix. This is the portion of the unit name that comes before the@ symbol.
  • %P: This is the same as above, but with any escaping reversed.
  • %i: This references the instance name, which is the identifier following the @ in the instance unit. This is one of the most commonly used specifiers because it will be guaranteed to be dynamic. The use of this identifier encourages the use of configuration significant identifiers. For example, the port that the service will be run at can be used as the instance identifier and the template can use this specifier to set up the port specification.
  • %I: This specifier is the same as the above, but with any escaping reversed.
  • %f: This will be replaced with the unescaped instance name or the prefix name, prepended with a/.
  • %c: This will indicate the control group of the unit, with the standard parent hierarchy of/sys/fs/cgroup/ssytemd/ removed.
  • %u: The name of the user configured to run the unit.
  • %U: The same as above, but as a numeric UID instead of name.
  • %H: The host name of the system that is running the unit.
  • %%: This is used to insert a literal percentage sign.
By using the above identifiers in a template file, systemd will fill in the correct values when interpreting the template to create an instance unit.


Conclusion

When working with systemd, understanding units and unit files can make administration simple. Unlike many other init systems, you do not have to know a scripting language to interpret the init files used to boot services or the system. The unit files use a fairly simple declarative syntax that allows you to see at a glance the purpose and effects of a unit upon activation.

Breaking functionality such as activation logic into separate units not only allows the internal systemdprocesses to optimize parallel initialization, it also keeps the configuration rather simple and allows you to modify and restart some units without tearing down and rebuilding their associated connections. Leveraging these abilities can give you more flexibility and power during administration.

By learning how to leverage your init system's strengths, you can control the state of your machines and more easily manage your services and processes.
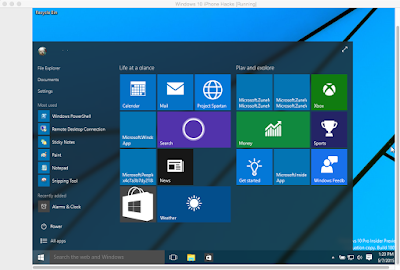
How To Setup a Firewall with UFW (Uncomplicated Firewall) on an Ubuntu and Debian Server

$
0
0
One of the first lines of defense in securing your cloud server is a functioning firewall. In the past, this was often done through complicated and arcane utilities.

There is a lot of functionality built into these utilities, iptables being the most popular nowadays, but they require a decent effort on behalf of the user to learn and understand them. Firewall rules are not something you want yourself second-guessing.

To this end, UFW is a considerably easier-to-use alternative.


What is UFW?

UFW, or Uncomplicated Firewall, is a front-end to iptables. Its main goal is to make managing your firewall drop-dead simple and to provide an easy-to-use interface. It’s well-supported and popular in the Linux community—even installed by default in a lot of distros. As such, it’s a great way to get started securing your sever.

Before We Get Started

First, obviously, you want to make sure UFW is installed. It should be installed by default in Ubuntu, but if for some reason it’s not, you can install the package using aptitude or apt-get using the following commands:

sudo aptitude install ufw

or
sudo apt-get install ufw

Check the Status

You can check the status of UFW by typing:
sudo ufw status

Right now, it will probably tell you it is inactive. Whenever ufw is active, you’ll get a listing of the current rules that looks similar to this:
Status: active

To Action From
-- ------ ----
22 ALLOW Anywhere

Using IPv6 with UFW

If your VPS is configured for IPv6, ensure that UFW is configured to support IPv6 so that will configure both your IPv4 and IPv6 firewall rules. To do this, open the UFW configuration with this command:
sudo vi /etc/default/ufw

Then make sure "IPV6" is set to "yes", like so:
IPV6=yes

Save and quit. Then restart your firewall with the following commands:
sudo ufw disable
sudo ufw enable

Now UFW will configure the firewall for both IPv4 and IPv6, when appropriate.

Set Up Defaults

One of the things that will make setting up any firewall easier is to define some default rules for allowing and denying connections. UFW’s defaults are to deny all incoming connections and allow all outgoing connections. This means anyone trying to reach your cloud server would not be able to connect, while any application within the server would be able to reach the outside world.

To set the defaults used by UFW, you would use the following commands:
sudo ufw default deny incoming
and
sudo ufw default allow outgoing

Note: if you want to be a little bit more restrictive, you can also deny all outgoing requests as well.

The necessity of this is debatable, but if you have a public-facing cloud server, it could help prevent against any kind of remote shell connections. It does make your firewall more cumbersome to manage because you’ll have to set up rules for all outgoing connections as well.

You can set this as the default with the following:
sudo ufw default deny outgoing

Allow Connections

The syntax is pretty simple. You change the firewall rules by issuing commands in the terminal. If we turned on our firewall now, it would deny all incoming connections. If you’re connected over SSH to your cloud server, that would be a problem because you would be locked out of your server. Let’s enable SSH connections to our server to prevent that from happening:
sudo ufw allow ssh

As you can see, the syntax for adding services is pretty simple. UFW comes with some defaults for common uses. Our SSH command above is one example. It’s basically just shorthand for:
sudo ufw allow 22/tcp

This command allows a connection on port 22 using the TCP protocol. If our SSH server is running on port 2222, we could enable connections with the following command:
sudo ufw allow 2222/tcp

Other Connections We Might Need

Now is a good time to allow some other connections we might need. If we’re securing a web server with FTP access, we might need these commands:
sudo ufw allow www or sudo ufw allow 80/tcp sudo ufw allow ftp or sudo ufw allow 21/tcp

You mileage will vary on what ports and services you need to open. There will probably be a bit of testing necessary. In addition, you want to make sure you leave your SSH connection allowed.

Port Ranges

You can also specify port ranges with UFW. To allow ports 1000 through 2000, use the command:
sudo ufw allow 1000:2000/tcp

If you want UDP:
sudo ufw allow 1000:2000/udp

IP Addresses

You can also specify IP addresses. For example, if I wanted to allow connections from a specific IP address (say my work or home address), I’d use this command:
sudo ufw allow from 192.168.255.255

Denying Connections

Our default set up is to deny all incoming connections. This makes the firewall rules easier to administer since we are only selectively allowing certain ports and IP addresses through.

However, if you want to flip it and open up all your server’s ports (not recommended), you could allow all connections and then restrictively deny ports you didn’t want to give access to by replacing “allow” with “deny” in the commands above.

For example:

sudo ufw allow 80/tcp
would allow access to port 80 while:
sudo ufw deny 80/tcp
would deny access to port 80.

Deleting Rules

There are two options to delete rules. The most straightforward one is to use the following syntax:
sudo ufw delete allow ssh

As you can see, we use the command “delete” and input the rules you want to eliminate after that. Other examples include:
sudo ufw delete allow 80/tcp

or
sudo ufw delete allow 1000:2000/tcp

This can get tricky when you have rules that are long and complex.

A simpler, two-step alternative is to type:
sudo ufw status numbered

which will have UFW list out all the current rules in a numbered list. Then, we issue the command:
sudo ufw delete [number]

where “[number]” is the line number from the previous command.

Turn It On

After we’ve gotten UFW to where we want it, we can turn it on using this command (remember: if you’re connecting via SSH, make sure you’ve set your SSH port, commonly port 22, to be allowed to receive connections):
sudo ufw enable

You should see the command prompt again if it all went well. You can check the status of your rules now by typing:
sudo ufw status

or
sudo ufw status verbose
for the most thorough display.

To turn UFW off, use the following command:
sudo ufw disable

Reset Everything

If, for whatever reason, you need to reset your cloud server’s rules to their default settings, you can do this by typing this command:
sudo ufw reset

Conclusion

You should now have a cloud server that is configured properly to restrict access to a subset of ports or IP addresses.

How to run Windows 10 on Mac for free with VirtualBox

$
0
0


Using VirtualBox, Mac users can install Windows 10 onto their devices, without the need to use Boot Camp or install the pricey but popular, Parallels. Unlike Parallels, VirtualBox allows Windows 
to run inside of the Mac OS X, versus acting like its own separate operating system. Basically, 
VirtualBox runs Windows like an application, and it can be closed and opened just a you would 
iTunes. This makes it very convenient for casual use.


Step 1.

Head over to the VirtualBox download page and find the version for OS X. Download and install as you would any application downloaded from the web.

Step 2.
Download the Windows 10 Preview ISO from Microsoft. Take a look at these system requirements to ensure that you can install Windows 10 without any major issues. Simply put, the better specs your computer has, the better Windows 10 will run. After you download the ISO make sure to place it on your Desktop or take note of where it’s saved.

Step 3. 
Run VirtualBox and click “New” in the application sidebar. In the following window, create a name for the new OS you are installing and click Continue.


Step 4.When you hit continue you will be asked to choose the Hard Drive File Type. You can leave this at the default (VDI) unless you have a particular preference for the other options. On the next page select Dynamically allocated and press Continue.


Step 5.Next, select “Create a Virtual hard drive now” and click Create.


Step 6.At the main menu, click Start at the top of the window. Disregard the information at the center of the screen for now.


Step 7.Once you click start you’ll need to select the Windows ISO you downloaded. Click on the folder icon to find your file and select Start.


Step 8.The installation process should start in a few moments. Select your language when prompted and click Next. The normal Windows installation process will begin. Please note that this process may take some time.


Step 9.
When setup is compete you will be running Windows 10 on your Mac.


Running VirtualBox is going to affect your computer’s overall performance since you are basically running two systems at the same time. This method is for a more casual Windows experience.

If you want a fully realized interpretation of Windows 10, then you’ll want to use Boot Camp and create a bootable system as a completely separate entity.

We are using the Windows 10 preview, which is the full version of Windows 10 ahead of its official release. This means that once Windows 10 comes out you will need to purchase or download the new version.

You can quit your Windows VirtualBox at anytime by quitting VirtualBox. You can completely delete your Windows 10 with VirtualBox. All documents and files on the OS will also be removed completely.

Are 600 Million Samsung Android Phones Really at Risk?

$
0
0
A report alleges a significant risk to Samsung phones, but the threat may be overstated. It is just one of many risks Android device users face. Samsung is facing accusations that it has a vulnerability in its Android phones that could be leaving more than 600 million users at risk. Security firm NowSecure first disclosed the vulnerability, known as CVE-2015-2865.

While the vulnerability poses risks, the simple truth is that it is just one of many that could potentially impact Samsung's Android users.


NowSecure has published a detailed technical analysis on the issue, which is a flaw in how the Swiftkey keyboard app validates language pack updates. The Swiftkey keyboard is installed by default in Samsung's Galaxy phones.

"By design, Swiftkey periodically checks for language pack updates over HTTP," the CERT vulnerability note on the issue states. "By intercepting such requests and modifying the necessary fields, an attacker can write arbitrary data to vulnerable devices."

NowSecure warns in its own advisory that if an attacker exploits the SwiftKey flaw, they could access the phone's camera, secretly install apps and access user data. NowSecure claims that it informed Samsung of the issue in December 2014. That means that NowSecure waited six months before publicly disclosing this issue, which is significantly longer than NowSecure's stated responsible disclosure policy terms of only 30 days that the company normally uses. 

There is indeed a risk of a potential man-in-the-middle (MiTM) attack in which an attacker intercepts the update traffic for SwiftKey. As a result of the interception, and SwiftKey's elevated system privileges, the attacker can then do what he or she wants with a user's device. In principle, this attack sounds scary, but it's neither unique nor novel. 

Despite the researchers' claims of 600 million Samsung users at risk, the simple truth is that likely most of the same users (if not more) are already at risk from any number of different Android issues. At the core of the SwiftKey flaw is the incorrect use of an update mechanism. I've written on this topic at great length, and it is well-known. In August 2014, FireEye, for example, published a report noting that 68 percent of the 1,000 most downloaded free applications available in the Google Play store have some form of SSL-related security risk. 

Secure Sockets Layer/Transport Layer Security (SSL/TLS) is the encrypted data transport technology used to prevent snooping of traffic sent over the Internet. In February, Intel Security's McAfee Labs published a threat report that came to the same basic conclusion, namely that many of the most popular Android apps have SSL-related risks. 

Any of those apps could have potentially been victimized in a MiTM attack. It's true that not all of those apps have system privileges like SwiftKey, but the risk to users is still there. NowSecure suggests that users avoid non-secure WiFi networks and ask their carriers for a patch. 

Both those suggestions are always good ideas and can limit risks to Android, in general. The biggest risk to Android in my opinion isn't unpatched Android vulnerabilities, but rather a lack of patches from carriers or even Google for older non-supported devices. 

Most devices are only supported for two years from the time the device is first released, leaving many millions of unpatched Android devices in use today. 

Jeff Forristal, CTO of mobile security vendor Bluebox Security, explained that older Android vulnerabilities that he first disclosed at the Black Hat 2013 and 2014 conferences still pose risks in 2015. 

So, while this new SwiftKey vulnerability is a concern, Android users need to be concerned about a lot of other things.

How To Install Bacula Server on Ubuntu 14.04

$
0
0
Bacula is an open source network backup solution that allows you create backups and perform data recovery of your computer systems. It is very flexible and robust, which makes it, while slightly cumbersome to configure, suitable for backups in many situations. A backup system is an important component in most server infrastructures, as recovering from data loss is often a critical part of disaster recovery plans.


In this tutorial, we will show you how to install and configure the server components of Bacula on an Ubuntu 14.04 server. We will configure Bacula to perform a weekly job that creates a local backup (i.e. a backup of its own host). This, by itself, is not a particularly compelling use of Bacula, but it will provide you with a good starting point for creating backups of your other servers, i.e. the backup clients. The next tutorial in this series will cover creating backups of your other, remote, servers by installing and configuring the Bacula client, and configuring the Bacula server.

Prerequisites

You must have superuser (sudo) access on an Ubuntu 14.04 server. Also, the server will require adequate disk space for all of the backups that you plan on retaining at any given time.

We will configure Bacula to use the private FQDN of our servers, e.g. bacula.private.example.com. If you don't have a DNS setup, use the appropriate IP addresses instead. If you don't have private networking enabled, replace all network connection information in this tutorial with network addresses that are reachable by servers in question (e.g. public IP addresses or VPN tunnels).

Let's get started by looking at an overview of Bacula's components.

Bacula Component Overview

Although Bacula is composed of several software components, it follows the server-client backup model; to simplify the discussion, we will focus more on the backup server and the backup clients than the individual Bacula components. Still, it is important to have cursory knowledge of the various Bacula components, so we will go over them now.

A Bacula server, which we will also refer to as the "backup server", has these components:
  • Bacula Director (DIR): Software that controls the backup and restore operations that are performed by the File and Storage daemons
  • Storage Daemon (SD): Software that performs reads and writes on the storage devices used for backups
  • Catalog: Services that maintain a database of files that are backed up. The database is stored in an SQL database such as MySQL or PostgreSQL
  • Bacula Console: A command-line interface that allows the backup administrator to interact with, and control, Bacula Director
Note: The Bacula server 
components don't need to run on the same server, but they all work
together to provide the backup server functionality.

A Bacula client, i.e. a server that will be backed up, runs the File Daemon (FD) component. The File Daemon is software that provides the Bacula server (the Director, specifically) access to the data that will be backed up. We will also refer to these servers as "backup clients" or "clients".

As we noted in the introduction, we will configure the backup server to create a backup of its own filesystem. This means that the backup server will also be a backup client, and will run the File Daemon component.

Let's get started with the installation.

Install MySQL

Bacula uses an SQL database, such as MySQL or PostreSQL, to manage its backups catalog. We will use MySQL in this tutorial.
First, update apt-get:

  • sudo apt-get update


Now install MySQL Server with apt-get:

  • sudo apt-get install mysql-server


You will be prompted for a password for the MySQL database administrative user, root. Enter a password, then confirm it.

Remember this password, as it will be used in the Bacula installation process.

Install Bacula

Install the Bacula server and client components, using apt-get:

  • sudo apt-get install bacula-server bacula-client


You will be prompted for some information that will be used to configure Postfix, which Bacula uses:
  • General Type of Mail Configuration: Choose "Internet Site"
  • System Mail Name: Enter your server's FQDN or hostname
Next, you will be prompted for information that will be used to set up the Bacula database:
  • Configure database for bacula-director-mysql with dbconfig-common?: Select "Yes"
  • Password of the database's administrative user: Enter your MySQL root password (set during MySQL installation)
  • MySQL application password for bacula-director-mysql: Enter a new password and confirm it, or leave the prompt blank to generate a random password
The last step in the installation is to update the permissions of a script that Bacula uses during its catalog backup job:

  • sudo chmod 755 /etc/bacula/scripts/delete_catalog_backup


The Bacula server (and client) components are now installed. Let's create the backup and restore directories.

Create Backup and Restore Directories

Bacula needs a backup directory—for storing backup archives—and restore directory—where restored files will be placed. If your system has multiple partitions, make sure to create the directories on one that has sufficient space.

Let's create new directories for both of these purposes:

  • sudo mkdir -p /bacula/backup /bacula/restore


We need to change the file permissions so that only the bacula process (and a superuser) can access these locations:

  • sudo chown -R bacula:bacula /bacula

  • sudo chmod -R 700 /bacula


Now we're ready to configure the Bacula Director.

Configure Bacula Director

Bacula has several components that must be configured independently in order to function correctly. The configuration files can all be found in the /etc/bacula directory.

We'll start with the Bacula Director.

Open the Bacula Director configuration file in your favorite text editor. We'll use vi:

  • sudo vi /etc/bacula/bacula-dir.conf


Configure Local Jobs

A Bacula job is used to perform backup and restore actions. Job resources define the details of what a particular job will do, including the name of the Client, the FileSet to back up or restore, among other things.

Here, we will configure the jobs that will be used to perform backups of the local filesystem.

In the Director configuration, find the Job resource with a name of "BackupClient1" (search for "BackupClient1"). Change the value of Name to "BackupLocalFiles", so it looks like this:
bacula-dir.conf — Rename BackupClient1 job
Job {
Name = "BackupLocalFiles"
JobDefs = "DefaultJob"
}
Next, find the Job resource that is named "RestoreFiles" (search for "RestoreFiles"). In this job, you want to change two things: update the value of Name to "RestoreLocalFiles", and the value of Where to "/bacula/restore". It should look like this:

bacula-dir.conf — Rename RestoreFiles job
Job {
Name = "RestoreLocalFiles"
Type = Restore
Client=BackupServer-fd
FileSet="Full Set"
Storage = File
Pool = Default
Messages = Standard
Where = /bacula/restore
}

This configures the RestoreLocalFiles job to restore files to /bacula/restore, the directory we created earlier.

Configure File Set

A Bacula FileSet defines a set of files or directories to include or exclude files from a backup selection, and are used by jobs.

Find the FileSet resource named "Full Set" (it's under a comment that says, "# List of files to be backed up"). Here we will make three changes: (1) Add the option to use gzip to compress our backups, (2) change the include File from /usr/sbin to /, and (3) change the second exclude File to /bacula. With the comments removed, it should look like this:
bacula-dir.conf — Update "Full Set" FileSet
FileSet {
Name = "Full Set"
Include {
Options {
signature = MD5
compression = GZIP
}
File = /
}
Exclude {
File = /var/lib/bacula
File = /bacula
File = /proc
File = /tmp
File = /.journal
File = /.fsck
}
}
Let's go over the changes that we made to the "Full Set" FileSet. First, we enabled gzip compression when creating a backup archive. Second, we are including /, i.e. the root partition, to be backed up.

Third, we are excluding /bacula because we don't want to redundantly back up our Bacula backups and restored files.

Note: If you have partitions 
that are mounted within /, and you want to include those in the FileSet,
you will need to include additional File records for each of them.

Keep in mind that if you always use broad FileSets, like "Full Set", in your backup jobs, your backups will require more disk space than if your backup selections are more specific. For example, a FileSet that only includes your customized configuration files and databases might be sufficient for your needs, if you have a clear recovery plan that details installing required software packages and placing the restored files in the proper locations, while only using a fraction of the disk space for backup archives.

Configure Storage Daemon Connection

In the Bacula Director configuration file, the Storage resource defines the Storage Daemon that the Director should connect to. We'll configure the actual Storage Daemon in just a moment.

Find the Storage resource, and replace the value of Address, localhost, with the private FQDN (or private IP address) of your backup server. It should look like this (substitute the highlighted word):
bacula-dir.conf — Update Storage Address
 
Storage {
Name = File
# Do not use "localhost" here
Address = backup_server_private_FQDN # N.B. Use a fully qualified name here
SDPort = 9103
Password = "ITXAsuVLi1LZaSfihQ6Q6yUCYMUssdmu_"
Device = FileStorage
Media Type = File
}

This is necessary because we are going to configure the Storage Daemon to listen on the private network interface, so remote clients can connect to it.

Configure Pool

A Pool resource defines the set of storage used by Bacula to write backups. We will use files as our storage volumes, and we will simply update the label so our local backups get labeled properly.

Find the Pool resource named "File" (it's under a comment that says "# File Pool definition"), and add a line that specifies a Label Format. It should look like this when you're done:
bacula-dir.conf — Update Pool:
 
# File Pool definition
Pool {
Name = File
Pool Type = Backup
Label Format = Local-
Recycle = yes # Bacula can automatically recycle Volumes
AutoPrune = yes # Prune expired volumes
Volume Retention = 365 days # one year
Maximum Volume Bytes = 50G # Limit Volume size to something reasonable
Maximum Volumes = 100 # Limit number of Volumes in Pool
}

Save and exit. You're finally done configuring the Bacula Director.

Check Director Configuration:

Let's verify that there are no syntax errors in your Director configuration file:

  • sudo bacula-dir -tc /etc/bacula/bacula-dir.conf


If there are no error messages, your bacula-dir.conf file has no syntax errors.
Next, we'll configure the Storage Daemon.

Configure Storage Daemon

Our Bacula server is almost set up, but we still need to configure the Storage Daemon, so Bacula knows where to store backups.

Open the SD configuration in your favorite text editor. We'll use vi:

  • sudo vi /etc/bacula/bacula-sd.conf


Configure Storage Resource

Find the Storage resource. This defines where the SD process will listen for connections. Add the SDAddress parameter, and assign it to the private FQDN (or private IP address) of your backup server:

bacula-sd.conf — update SDAddress
 
Storage {                             # definition of myself
Name = BackupServer-sd
SDPort = 9103 # Director's port
WorkingDirectory = "/var/lib/bacula"
Pid Directory = "/var/run/bacula"
Maximum Concurrent Jobs = 20
SDAddress = backup_server_private_FQDN
}
 

Configure Storage Device

Next, find the Device resource named "FileStorage" (search for "FileStorage"), and update the value of Archive Device to match your backups directory:
bacula-sd.conf — update Archive Device
 
Device {
Name = FileStorage
Media Type = File
Archive Device = /bacula/backup
LabelMedia = yes; # lets Bacula label unlabeled media
Random Access = Yes;
AutomaticMount = yes; # when device opened, read it
RemovableMedia = no;
AlwaysOpen = no;
}

Save and exit.

Verify Storage Daemon Configuration

Let's verify that there are no syntax errors in your Storage Daemon configuration file:

  • sudo bacula-sd -tc /etc/bacula/bacula-sd.conf


If there are no error messages, your bacula-sd.conf file has no syntax errors.
We've completed the Bacula configuration. We're ready to restart the Bacula server components.

Restart Bacula Director and Storage Daemon

To put the configuration changes that you made into effect, restart Bacula Director and Storage Daemon with these commands:

  • sudo service bacula-director restart

  • sudo service bacula-sd restart


Now that both services have been restarted, let's test that it works by running a backup job.

Test Backup Job

We will use the Bacula Console to run our first backup job. If it runs without any issues, we will know that Bacula is configured properly.

Now enter the Console with this command:

  • sudo bconsole


This will take you to the Bacula Console prompt, denoted by a * prompt.

Create a Label

Begin by issuing a label command:

  • label


You will be prompted to enter a volume name. Enter any name that you want:

Enter new Volume name:

MyVolume
Then select the pool that the backup should use. We'll use the "File" pool that we configured earlier, by entering "2":

Select the Pool (1-3):

2
 

Manually Run Backup Job

Bacula now knows how we want to write the data for our backup. We can now run our backup to test that it works correctly:

  • run


You will be prompted to select which job to run. We want to run the "BackupLocalFiles" job, so enter "1" at the prompt:

Select Job resource (1-3):

1
At the "Run Backup job" confirmation prompt, review the details, then enter "yes" to run the job:

  • yes


Check Messages and Status

After running a job, Bacula will tell you that you have messages. The messages are output generated by running jobs.
Check the messages by typing:

  • messages


The messages should say "No prior Full backup Job record found", and that the backup job started. If there are any errors, something is wrong, and they should give you a hint as to why the job did not run.

Another way to see the status of the job is to check the status of the Director. To do this, enter this command at the bconsole prompt:

  • status director


If everything is working properly, you should see that your job is running. Something like this:


Output — status director (Running Jobs)

Running Jobs:
Console connected at 09-Apr-15 12:16
JobId Level Name Status
======================================================================
3 Full BackupLocalFiles.2015-04-09_12.31.41_06 is running
====

When your job completes, it will move to the "Terminated Jobs" section of the status report, like this:


Output — status director (Terminated Jobs)

Terminated Jobs:
JobId Level Files Bytes Status Finished Name
====================================================================
3 Full 161,124 877.5 M OK 09-Apr-15 12:34 BackupLocalFiles

The "OK" status indicates that the backup job ran without any problems. Congratulations! You have a backup of the "Full Set" of your Bacula server.

The next step is to test the restore job.

Test Restore Job

Now that a backup has been created, it is important to check that it can be restored properly. The restore command will allow us restore files that were backed up.

Run Restore All Job

To demonstrate, we'll restore all of the files in our last backup:

  • restore all


A selection menu will appear with many different options, which are used to identify which backup set to restore from. Since we only have a single backup, let's "Select the most recent backup"—select option 5:


Select item (1-13):

5

Because there is only one client, the Bacula server, it will automatically be selected.
The next prompt will ask which FileSet you want to use. Select "Full Set", which should be 2:


Select FileSet resource (1-2):

2

This will drop you into a virtual file tree with the entire directory structure that you backed up. This shell-like interface allows for simple commands to mark and unmark files to be restored.
Because we specified that we wanted to "restore all", every backed up file is already marked for restoration. Marked files are denoted by a leading * character.

If you would like to fine-tune your selection, you can navigate and list files with the "ls" and "cd" commands, mark files for restoration with "mark", and unmark files with "unmark". A full list of commands is available by typing "help" into the console.

When you are finished making your restore selection, proceed by typing:

  • done


Confirm that you would like to run the restore job:


OK to run? (yes/mod/no):

yes
 

Check Messages and Status

As with backup jobs, you should check the messages and Director status after running a restore job.
Check the messages by typing:

  • messages


There should be a message that says the restore job has started or was terminated with an "Restore OK" status. If there are any errors, something is wrong, and they should give you a hint as to why the job did not run.
Again, checking the Director status is a great way to see the state of a restore job:

  • status director


When you are finished with the restore, type exit to leave the Bacula Console:

  • exit


Verify Restore

To verify that the restore job actually restored the selected files, you can look in the /bacula/restore directory (which was defined in the "RestoreLocalFiles" job in the Director configuration):

  • sudo ls -la /bacula/restore


You should see restored copies of the files in your root file system, excluding the files and directories that were listed in the "Exclude" section of the "RestoreLocalFiles" job. If you were trying to recover from data loss, you could copy the restored files to their appropriate locations.

Delete Restored Files

You may want to delete the restored files to free up disk space. To do so, use this command:

  • sudo -u root bash -c "rm -rf /bacula/restore/*"


Note that you have to run this rm command as root, as many of the restored files are owned by root.

Conclusion

You now have a basic Bacula setup that can backup and restore your local file system. The next step is to add your other servers as backup clients so you can recover them, in case of data loss.

How To Configure FirewallD to Protect Your CentOS 7 Server

$
0
0
Firewalld is a complete firewall solution available by default on CentOS 7 servers. In this guide, we will cover how to set up a firewall for your server and show you the basics of managing the firewall with the firewall-cmd administrative tool.

Basic Concepts in Firewalld

Before we begin talking about how to actually use the firewall-cmd utility to manage your firewall configuration, we should get familiar with a few basic concepts that the tool introduces.

Zones

The firewalld daemon manages groups of rules using entities called "zones". Zones are basically sets of rules dictating what traffic should be allowed depending on the level of trust you have in the networks your computer is connected to. Network interfaces are assigned a zone to dictate the behavior that the firewall should allow.

For computers that might move between networks frequently (like laptops), this kind of flexibility provides a good method of changing your rules depending on your environment. You may have strict rules in place prohibiting most traffic when operating on a public WiFi network, while allowing more relaxed restrictions when connected to your home network. For a server, these zones are not as immediately important because the network environment rarely, if ever, changes.

Regardless of how dymaic your network environment may be, it is still useful to be familiar with the general idea behind each of the pre-defined zones for firewalld. In order from least trusted to most trusted, the pre-defined zones within firewalld are:
  • drop: The lowest level of trust. All incoming connections are dropped without reply and only outgoing connections are possible.
  • block: Similar to the above, but instead of simply dropping connections, incoming requests are rejected with an icmp-host-prohibited or icmp6-adm-prohibited message.
  • public: Represents public, untrusted networks. You don't trust other computers but may allow selected incoming connections on a case-by-case basis.
  • external: External networks in the event that you are using the firewall as your gateway. It is configured for NAT masquerading so that your internal network remains private but reachable.
  • internal: The other side of the external zone, used for the internal portion of a gateway. The computers are fairly trustworthy and some additional services are available.
  • dmz: Used for computers located in a DMZ (isolated computers that will not have access to the rest of your network). Only certain incoming connections are allowed.
  • work: Used for work machines. Trust most of the computers in the network. A few more services might be allowed.
  • home: A home environment. It generally implies that you trust most of the other computers and that a few more services will be accepted.
  • trusted: Trust all of the machines in the network. The most open of the available options and should be used sparingly.
To use the firewall, we can create rules and alter the properties of our zones and then assign our network interfaces to whichever zones are most appropriate.

Rule Permanence

In firewalld, rules can be designated as either permanent or immediate. If a rule is added or modified, by default, the behavior of the currently running firewall is modified. At the next boot, the old rules will be reverted.

Most firewall-cmd operations can take the --permanent flag to indicate that the non-ephemeral firewall should be targeted. This will affect the rule set that is reloaded upon boot. This separation means that you can test rules in your active firewall instance and then reload if there are problems. You can also use the --permanent flag to build out an entire set of rules over time that will all be applied at once when the reload command is issued.

Turning on the Firewall

Before we can begin to create our firewall rules, we need to actually turn the daemon on. The systemd unit file is called firewalld.service. We can start the daemon for this session by typing:

  • sudo systemctl start firwalld.service


We can verify that the service is running and reachable by typing:

  • firewall-cmd --state


output

running

This indicates that our firewall is up and running with the default configuration.
At this point, we will not enable the service. Enabling the service would cause the firewall to start up at boot. We should wait until we have created our firewall rules and had an opportunity to test them before configuring this behavior. This can help us avoid being locked out of the machine if something goes wrong.

Getting Familiar with the Current Firewall Rules

Before we begin to make modifications, we should familiarize ourselves with the default environment and rules provided by the daemon.

Exploring the Defaults

We can see which zone is currently selected as the default by typing:

  • firewall-cmd --get-default-zone


output

public

Since we haven't given firewalld any commands to deviate from the default zone, and none of our interfaces are configured to bind to another zone, that zone will also be the only "active" zone (the zone that is controlling the traffic for our interfaces). We can verify that by typing:

  • firewall-cmd --get-active-zones


output

public
interfaces: eth0 eth1

Here, we can see that we have two network interfaces being controlled by the firewall (eth0 and eth1). They are both currently being managed according to the rules defined for the public zone.
How do we know what rules are associated with the public zone though? We can print out the default zone's configuration by typing:

  • firewall-cmd --list-all


output

public (default, active)
interfaces: eth0 eth1
sources:
services: dhcpv6-client ssh
ports:
masquerade: no
forward-ports:
icmp-blocks:
rich rules:

We can tell from the output that this zone is both the default and active and that the eth0 and eth1 interfaces are associated with this zone (we already knew all of this from our previous inquiries). However, we can also see that this zone allows for the normal operations associated with a DHCP client (for IP address assignment) and SSH (for remote administration). 

Exploring Alternative Zones

Now we have a good idea about the configuration for the default and active zone. We can find out information about other zones as well.

To get a list of the available zones, type:

  • firewall-cmd --get-zones


output

block dmz drop external home internal public trusted work

We can see the specific configuration associated with a zone by including the --zone= parameter in our --list-all command:

  • firewall-cmd --zone=home --list-all


output

home
interfaces:
sources:
services: dhcpv6-client ipp-client mdns samba-client ssh
ports:
masquerade: no
forward-ports:
icmp-blocks:
rich rules:
 
You can output all of the zone definitions by using the --list-all-zones option. You will probably want to pipe the output into a pager for easier viewing:

  • firewall-cmd --list-all-zones | less


Selecting Zones for your Interfaces

Unless you have configured your network interfaces otherwise, each interface will be put in the default zone when the firewall is booted.

Changing the Zone of an Interface for the Current Session

You can transition an interface between zones during a session by using the --zone= parameter in combination with the --change-interface= parameter. As with all commands that modify the firewall, you will need to use sudo.

For instance, we can transition our eth0 interface to the "home" zone by typing this:

  • sudo firewall-cmd --zone=home --change-interface=eth0


output

success
Note
Whenever you are transitioning an interface to a new zone, be aware that you are probably modifying the services that will be operational. For instance, here we are moving to the "home" zone, which has SSH available. This means that our connection shouldn't drop. Some other zones do not have SSH enabled by default and if your connection is dropped while using one of these zones, you could find yourself unable to log back in.

We can verify that this was successful by asking for the active zones again:

  • firewall-cmd --get-active-zones


output

home
interfaces: eth0
public
interfaces: eth1

If the firewall is completely restarted, the interface will revert to the default zone:

  • sudo systemctl restart firewalld.service

  • firewall-cmd --get-active-zones


output

public
interfaces: eth0 eth1
 

Changing the Zone of your Interface Permanently

Interfaces will always revert to the default zone if they do not have an alternative zone defined within their configuration. On CentOS, these configurations are defined within the /etc/sysconfig/network-scripts directory with files of the format ifcfg-interface.

To define a zone for the interface, open up the file associated with the interface you'd like to modify. We'll demonstrate making the change we showed above permanent:

  • sudo nano /etc/sysconfig/network-scripts/ifcfg-eth0


At the bottom of the file, set the ZONE= variable to the zone you wish to associate with the interface. In our case, this would be the "home" interface:
/etc/sysconfig/network-scripts/ifcfg-eth0
. . .

DNS1=2001:4860:4860::8844
DNS2=2001:4860:4860::8888
DNS3=8.8.8.8
ZONE=home
Save and close the file.

To implement your changes, you'll have to restart the network service, followed by the firewall service:

  • sudo systemctl restart network.service

  • sudo systemctl restart firewalld.service


After your firewall restarts, you can see that your eth0 interface is automatically placed in the "home" zone:

  • firewall-cmd --get-active-zones


output

home
interfaces: eth0
public
interfaces: eth1

Make sure to revert these changes if this is not the actual zone you'd like to use for this interface.

Adjusting the Default Zone

If all of your interfaces can best be handled by a single zone, it's probably easier to just select the best default zone and then use that for your configuration.

You can change the default zone with the --set-default-zone= parameter. This will immediately change any interface that had fallen back on the default to the new zone:

  • sudo firewall-cmd --set-default-zone=home


output

home
interfaces: eth0 eth1
 

Setting Rules for your Applications

The basic way of defining firewall exceptions for the services you wish to make available is easy. We'll run through the basic idea here.

Adding a Service to your Zones

The easiest method is to add the services or ports you need to the zones you are using. Again, you can get a list of the available services with the --get-services option:

  • firewall-cmd --get-services


output

RH-Satellite-6 amanda-client bacula bacula-client dhcp dhcpv6 dhcpv6-client dns ftp high-availability http https imaps ipp ipp-client ipsec kerberos kpasswd ldap ldaps libvirt libvirt-tls mdns mountd ms-wbt mysql nfs ntp openvpn pmcd pmproxy pmwebapi pmwebapis pop3s postgresql proxy-dhcp radius rpc-bind samba samba-client smtp ssh telnet tftp tftp-client transmission-client vnc-server wbem-https
Note
You can get more details about each of these services by looking at their associated .xml file within the /usr/lib/firewalld/services directory. For instance, the SSH service is defined like this:


/usr/lib/firewalld/services/ssh.xml


SSH
Secure Shell (SSH) is a protocol for logging into and executing commands on remote machines. It provides secure encrypted communications. If you plan on accessing your machine remotely via SSH over a firewalled interface, enable this option. You need the openssh-server package installed for this option to be useful.


You can enable a service for a zone using the --add-service= parameter. The operation will target the default zone or whatever zone is specified by the --zone= parameter. By default, this will only adjust the current firewall session. You can adjust the permanent firewall configuration by including the --permanent flag.

For instance, if we are running a web server serving conventional HTTP traffic, we can allow this traffic for interfaces in our "public" zone for this session by typing:

  • sudo firewall-cmd --zone=public --add-service=http


You can leave out the --zone= if you wish to modify the default zone. We can verify the operation was successful by using the --list-all or --list-services operations:

  • firewall-cmd --zone=public --list-services


output

dhcpv6-client http ssh

Once you have tested that everything is working as it should, you will probably want to modify the permanent firewall rules so that your service will still be available after a reboot. We can make our "public" zone change permanent by typing:

  • sudo firewall-cmd --zone=public --permanent --add-service=http


You can verify that this was successful by adding the --permanent flag to the --list-services operation. You need to use sudo for any --permanent operations:

  • sudo firewall-cmd --zone=public --permanent --list-services


output

dhcpv6-client http ssh

Your "public" zone will now allow HTTP web traffic on port 80. If your web server is configured to use SSL/TLS, you'll also want to add the https service. We can add that to the current session and the permanent rule-set by typing:

  • sudo firewall-cmd --zone=public --add-service=https

  • sudo firewall-cmd --zone=public --permanent --add-service=https


What If No Appropriate Service Is Available?

The firewall services that are included with the firewalld installation represent many of the most common requirements for applications that you may wish to allow access to. However, there will likely be scenarios where these services do not fit your requirements.
In this situation, you have two options.

Opening a Port for your Zones

The easiest way to add support for your specific application is to open up the ports that it uses in the appropriate zone(s). This is as easy as specifying the port or port range, and the associated protocol for the ports you need to open.

For instance, if our application runs on port 5000 and uses TCP, we could add this to the "public" zone for this session using the --add-port= parameter. Protocols can be either tcp or udp:

  • sudo firewall-cmd --zone=public --add-port=5000/tcp


We can verify that this was successful using the --list-ports operation:

  • firewall-cmd --list-ports


output

5000/tcp

It is also possible to specify a sequential range of ports by separating the beginning and ending port in the range with a dash. For instance, if our application uses UDP ports 4990 to 4999, we could open these up on "public" by typing:

  • sudo firewall-cmd --zone=public --add-port=4990-4999/udp


After testing, we would likely want to add these to the permanent firewall. You can do that by typing:

  • sudo firewall-cmd --zone=public --permanent --add-port=5000/tcp

  • sudo firewall-cmd --zone=public --permanent --add-port=4990-4999/udp

  • sudo firewall-cmd --zone=public --permanent --list-ports


output

success
success
4990-4999/udp 5000/tcp
 

Defining a Service

Opening ports for your zones is easy, but it can be difficult to keep track of what each one is for. If you ever decommission a service on your server, you may have a hard time remembering which ports that have been opened are still required. To avoid this situation, it is possible to define a service.

Services are simply collections of ports with an associated name and description. Using services is easier to administer than ports, but requires a bit of upfront work. The easiest way to start is to copy an existing script (found in /usr/lib/firewalld/services) to the /etc/firewalld/services directory where the firewall looks for non-standard definitions.

For instance, we could copy the SSH service definition to use for our "example" service definition like this. The filename minus the .xml suffix will dictate the name of the service within the firewall services list:

  • sudo cp /usr/lib/firewalld/services/service.xml /etc/firewalld/services/example.xml


Now, you can adjust the definition found in the file you copied:
sudo nano /etc/firewalld/services/example.xml

To start, the file will contain the SSH definition that you copied:
/etc/firewalld/services/example.xml


SSH
Secure Shell (SSH) is a protocol for logging into and executing commands on remote machines. It provides secure encrypted communications. If you plan on accessing your machine remotely via SSH over a firewalled interface, enable this option. You need the openssh-server package installed for this option to be useful.


The majority of this definition is actually metadata. You will want to change the short name for the service within the tags. This is a human-readable name for your service. You should also add a description so that you have more information if you ever need to audit the service. 

The only configuration you need to make that actually affects the functionality of the service will likely be the port definition where you identify the port number and protocol you wish to open. This can be specified multiple times.

For our "example" service, imagine that we need to open up port 7777 for TCP and 8888 for UDP. We could modify the existing definition with something like this:
/etc/firewalld/services/example.xml


Example Service
This is just an example service. It probably shouldn't be used on a real system.
tcp
" port="7777"/> udp" port="8888"/>

Save and close the file.

Reload your firewall to get access to your new service:

  • sudo firewall-cmd --reload


You can see that it is now among the list of available services:

  • firewall-cmd --get-services


output

RH-Satellite-6 amanda-client bacula bacula-client dhcp dhcpv6 dhcpv6-client dns example ftp high-availability http https imaps ipp ipp-client ipsec kerberos kpasswd ldap ldaps libvirt libvirt-tls mdns mountd ms-wbt mysql nfs ntp openvpn pmcd pmproxy pmwebapi pmwebapis pop3s postgresql proxy-dhcp radius rpc-bind samba samba-client smtp ssh telnet tftp tftp-client transmission-client vnc-server wbem-https

You can now use this service in your zones as you normally would.

Creating Your Own Zones

While the predefined zones will probably be more than enough for most users, it can be helpful to define your own zones that are more descriptive of their function.

For instance, you might want to create a zone for your web server, called "publicweb". However, you might want to have another zone configured for the DNS service you provide on your private network. You might want a zone called "privateDNS" for that.

When adding a zone, you must add it to the permanent firewall configuration. You can then reload to bring the configuration into your running session. For instance, we could create the two zones we discussed above by typing:

  • sudo firewall-cmd --permanent --new-zone=publicweb

  • sudo firewall-cmd --permanent --new-zone=privateDNS


You can verify that these are present in your permanent configuration by typing:

  • sudo firewall-cmd --permanent --get-zones


output

block dmz drop external home internal privateDNS public publicweb trusted work

As stated before, these won't be available in the current instance of the firewall yet:

  • firewall-cmd --get-zones


output

block dmz drop external home internal public trusted work

Reload the firewall to bring these new zones into the active configuration:

  • sudo firewall-cmd --reload

  • firewall-cmd --get-zones


output

block dmz drop external home internal privateDNS public publicweb trusted work

Now, you can begin assigning the appropriate services and ports to your zones. It's usually a good idea to adjust the active instance and then transfer those changes to the permanent configuration after testing. For instance, for the "publicweb" zone, you might want to add the SSH, HTTP, and HTTPS services:

  • sudo firewall-cmd --zone=publicweb --add-service=ssh

  • sudo firewall-cmd --zone=publicweb --add-service=http

  • sudo firewall-cmd --zone=publicweb --add-service=https

  • firewall-cmd --zone=publicweb --list-all


output

publicweb
interfaces:
sources:
services: http https ssh
ports:
masquerade: no
forward-ports:
icmp-blocks:
rich rules:

Likewise, we can add the DNS service to our "privateDNS" zone:

  • sudo firewall-cmd --zone=privateDNS --add-service=dns

  • firewall-cmd --zone=privateDNS --list-all


output

privateDNS
interfaces:
sources:
services: dns
ports:
masquerade: no
forward-ports:
icmp-blocks:
rich rules:

We could then change our interfaces over to these new zones to test them out:

  • sudo firewall-cmd --zone=publicweb --change-interface=eth0

  • sudo firewall-cmd --zone=privateDNS --change-interface=eth1


At this point, you have the opportunity to test your configuration. If these values work for you, you will want to add the same rules to the permanent configuration. You can do that by re-applying the rules with the --permanent flag:

  • sudo firewall-cmd --zone=publicweb --permanent --add-service=ssh

  • sudo firewall-cmd --zone=publicweb --permanent --add-service=http

  • sudo firewall-cmd --zone=publicweb --permanent --add-service=https

  • sudo firewall-cmd --zone=privateDNS --permanent --add-service=dns


You can then modify your network interfaces to automatically select the correct zones.

We can associate the eth0 interface with the "publicweb" zone:

  • sudo nano /etc/sysconfig/network-scripts/ifcfg-eth0


[label /etc/sysconfig/network-scripts/ifcfg-eth0
. . .

IPV6_AUTOCONF=no
DNS1=2001:4860:4860::8844
DNS2=2001:4860:4860::8888
DNS3=8.8.8.8
ZONE=publicweb

And we can associate the eth1 interface with "privateDNS":

  • sudo nano /etc/sysconfig/network-scripts/ifcfg-eth1


/etc/sysconfig/network-scripts/ifcfg-eth1
. . .

NETMASK=255.255.0.0
DEFROUTE='no'
NM_CONTROLLED='yes'
ZONE=privateDNS

Afterwards, you can restart your network and firewall services:

  • sudo systemctl restart network

  • sudo systemctl restart firewalld


Validate that the correct zones were assigned:

  • firewall-cmd --get-active-zones


output

privateDNS
interfaces: eth1
publicweb
interfaces: eth0

And validate that the appropriate services are available for both of the zones:

  • firewall-cmd --zone=publicweb --list-services


output

http htpps ssh

  • firewall-cmd --zone=privateDNS --list-services


output

dns
 
You have successfully set up your own zones. If you want to make one of these zones the default for other interfaces, remember to configure that behavior with the --set-default-zone= parameter:
sudo firewall-cmd --set-default-zone=publicweb
 

Enable Your Firewall to Start at Boot

At the beginning of the guide, we started our firewalld service, but we did not enable it. If you are happy with your current configuration and have tested that it is functional when you restart the service, you can safely enable the service.

To configure your firewall to start at boot, type:

  • sudo systemctl enable firewalld


When the server restarts, your firewall should be brought up, your network interfaces should be put into the zones you configured (or fall back to the configured default zone), and the rules associated with the zone(s) will be applied to the associated interfaces.


Conclusion

You should now have a fairly good understanding of how to administer the firewalld service on your CentOS system for day-to-day use.

The firewalld service allows you to configure maintainable rules and rule-sets that take into consideration your network environment. It allows you to seamlessly transition between different firewall policies through the use of zones and gives administrators the ability to abstract the port management into more friendly service definitions. Acquiring a working knowledge of this system will allow you to take advantage of the flexibility and power that this tool provides.

How to Root Any Samsung Galaxy S4 in One Click

$
0
0

Method # 1


Step 1: Download & Install TowelRoot

The process couldn't be easier—start by making sure you have installation from "Unknown sources" enabled, then just grab the TowelRoot apk from here and install.


We're rooting using a pretty genius method. It basically exploits the kernel, which freezes Android, and while the OS is sitting there panicking, it asks for root privileges and Android gives them to it. Then, it copies over the necessary root files and reboots the phone. But because of the way this exploit functions, you'll see a nice scary warning when installing TowelRoot—check that you understand the risks, then hit Install anyway.

Step 2: Run TowelRoot

Now hit the make it ra1n button, and let the app do its thing. It'll automatically reboot your device, and then you'll be rooted!


Yes, it really is that easy. Really.


Step 3: Install SuperSU

While TowelRoot will root your device, it will not install a root manager, which is critical for keeping malicious apps from gaining root access. Far and away the best root manager is SuperSU from developer Chainfire. Head to the Play Store to grab the app directly.


Install it and run. You can skip the part where the app asks if you'd like it to remove KNOX, but to each their own. Either way, you're rooted and ready to roll. And it couldn't have been easier.

Method # 2


Now root your GALAXY S4 by following the guide below!

Preparations :

  • Free download Kingo Android Root and install it on your computer.
  • Make sure your device is powered ON.
  • At least 50% battery level.
  • USB Cable (the original one recommended).
  • Enable USB Debugging on your device.


Step 1: Launch Android ROOT and connect GALAXY S4 to computer.

After downloading and installing, double-click the desktop icon of Android ROOT to launch the software. The interface will be shown as below. Then follow the instructions and connect your GALAXY S4 to computer via USB cable. It is highly recommended that you use the original cable and plug it into the back of your computer to make sure the connection is stable, which is critical to the whole rooting process.


Step 2: Waiting for automatic driver installation to complete.

You may need to wait a little longer if this is the first time you connect your device to computer. Driver software installation should be done automatically. But sometimes, it often goes wrong. Do not be frustrated and try several times. If it still fails, manually download and install the correspond driver on the official website of Samsung. Contact us at any time if necessary.


Step 3: Enable USB debugging mode on your GALAXY S4.

If you have already done this, skip this step and move on. If not, please follow the instructions as shown on the software interface according to your Android version.


Step 4: Read the notifications carefully before proceeding.

Rooting is a modification of the original operating system and it may lead to certain consequences. Before you jump into any operation, you should know the risks and make a wise decision. So if you are not sure what ROOT means, consult GOOGLE, refer to detailed information or contact us.


Step 5: Click ROOT to start the process when you are ready.

It will take 3 to 5 minutes to complete the process. Once you started, do not move, touch, unplug USB cable, or perform any operation on your device anyhow!


Step 6: ROOT Succeeded! Click Finish and wait for reboot.

Your device is now successfully rooted. And you need to click Finish to reboot it in order to make it more stable. Still, do not touch, move or unplug it until it reboots. Check your device and find out SuperSU icon, which is the mark of a successful ROOT.


One thing about Kingo ROOT that worth your attention is that there is the REMOVE ROOT function built in, which means you may use it to remove ROOT from your GALAXY S4 with just one-click as well, clean and simple.

Samsung Unveils Pair of All-New Galaxy S6 Smartphone Models

$
0
0
Samsung's next-generation Galaxy S6 smartphones, which include giant leaps in style, design, components and features from earlier models, have finally arrived after months of rumors about how Samsung would fight off Apple's latest iPhone 6 devices.

The new Galaxy models, a standard Galaxy S6 and a much flashier and more sculptured Galaxy S6 Edge that features a bright display which wraps around both sides of the handset, were unveiled at Mobile World Congress 2015 in Barcelona, Spain, on March 1 during a special "Samsung Galaxy Unpacked" event a day before MWC opens officially.


Our first impressions, after seeing and handling the new Galaxy models up close at a special press preview briefing in New York City last week, is that these Galaxy smartphones appear to hit the mark when it comes to taking on the iPhone 6 and the iPhone 6 Plus around the world.

The improvements in the new S6 smartphones over the previous Galaxy S5 model are many, from a chassis made of aircraft-grade aluminum to a higher resolution 5.1-inch, quad HD Super AMOLED display (2,560-by-1,440 resolution for the S6 versus 1,920-by-1,080 for the S5) that has about 80 percent more pixels (577 pixels per inch) than the S5. Corning Gorilla Glass 4 is used on both the front display and rear panel of the phones.


Both new Galaxy S6 models also include Samsung's latest 14nm technology, 64- bit Exynos 7 processors, which have eight cores and use less power while providing higher performance than previous chips made with 20nm manufacturing processes. Full specifications and clock speeds for the new processors were not available at press time. Android 5.0 Lollipop is running on both devices.

Both the Galaxy S6 and the Galaxy S6 Edge also include new LPDDR4 flash RAM and nonexpandable UFS 2.0 flash storage that will be available in three capacities—32GB, 64GB and 128GB. The new S6 phones differ from the old S5 and previous versions by omitting micro SD memory card slots due to space constraints as the new devices are thinner.


Like the previous Galaxy S5, the new S6 models offer a 16-megapixel rear camera, but the latest versions add Smart Optical Image Stabilization (OIS), a 1.9 f lens and automatic real-time High Dynamic Range (HDR) processing for improved picture quality in low light and other conditions, according to Samsung. The 5MP front camera of the new Galaxies is also improved, with a 1.9 f lens, HDR, new white balance detection for improved images and other improvements that let users get better "selfies" when using the camera. Fast-tracking auto-focus is also now featured on the new S6 models.

Faster access to the cameras is also a benefit of the new S6 models thanks to a new "fast launch" feature that lets users capture a photograph as quickly as hitting the home button twice. The new Galaxy versions are always on camera standby mode, making faster use of the cameras possible at the spur of the moment. That's a far cry from the previous Galaxy S4 and S5 models.


Improved and faster charging, as well as wireless charging capabilities, is also built into the newest Galaxy S6 phones, with a fast charging mode that allows users to charge the battery to 50 percent in just 20 minute using a corded charger. The wireless charging system works with WPC or PMA wireless charging systems and can provide a 50 percent device charge in about 30 minutes.

The Galaxy S6 includes a 2,550mAh nonremovable battery, while the S6 Edge includes a 2,600mAh nonremovable battery. Audio quality is also improved over the earlier S5 model, with a speaker that provides sound that is up to 1.5 times louder than the previous-generation audio system in the older devices.

Both smartphone models support 4G Long Term Evolution (LTE) networks and will support future LTE networks as they are adopted by mobile carriers, according to Samsung.

The S6 measures 5.64 inches in length, 2.77 inches in width and 0.26 inches in thickness, while the S6 Edge measures 5.59 inches by 2.75 inches by 0.27 inches. The S6 weighs 4.86 ounces, while the S6 Edge weighs 4.65 ounces. 

The S6 will be available in Black Sapphire, Gold Platinum, Blue Topaz and White Pearl, while the S6 Edge will be available in Black Sapphire, White Pearl, Gold Platinum and Green Emerald. The faceplate and backplate colors are actually created through the use of thin colored foil-like materials that are positioned on the backside of the glass on the front and rear of each phone.

Both smartphones are equipped with Samsung KNOX and upgraded Find My Mobile security features that help users keep their work and personal content separate on their devices.

An integrated mobile payments system will be included in both phone versions in the future, but it is not ready at launch, according to Samsung. The system will include support for near-field communication (NFC) wireless payments and Magnetic Secure Transmission transactions as used in today's magnetic card swiping systems for credit cards, according to Samsung.


The user interfaces in the S6 models have also been improved and simplified as product designers worked closely with the user interface team to refine and streamline the phones, according to the company. Function menus were reduced by some 40 percent.

Hong Yeo, a Samsung senior product designer based in Seoul, told us that developing the S6 models, which had been code-named Project Zero, has been the most exciting design project his team has ever worked on.

"Everyone involved got together to really come out with a complete package," said Yeo. "We took a step back and listened to what customers were saying and what they wanted to communicate" about features they wanted to see. "We wanted to create a device with a lot of warmth and character. Both models represent a new design era for Samsung. It's something we've been working on for years."

Creating the thinner, more futuristic and more stylish S6 devices shaved 1mm in thickness and 2mm in width from the previous S5 smartphones, according to Yeo. "In our world, that's a massive difference."


The design team was free to use any materials for the phones, as long as the materials met the design standards for the project, he said. A key highlight of the project became the use of glass and metal in the new devices.

"It's not just any glass," said Yeo. "We added a reflective structure under the glass to capture light. It's an emotional form wrapped around a different product that the world d has never seen before."

The new S6 phones will ship in the second quarter of 2015. Pricing information has not yet been released. The previous Galaxy S5 version was released in April 2014.

The Web Will 'Just Work' With Windows 10 Browser

$
0
0
Project Spartan on Windows 10 PCs represents a break from Internet Explorer's checkered history, claims the company.

After a series of leaks, Microsoft finally took the lid off its next-generation Web browser, dubbed Project Spartan, when it officially unveiled the Windows 10 operating system to the public on Jan. 21 during a press event.


A new rendering engine, minimalist UI and features that allow users to "mark up the Web directly" came together for a fresh take on Windows-based Web browsing during a demonstration at the company's Redmond, Wash., headquarters. Now, Microsoft is detailing how Project Spartan is a departure from Internet Explorer (IE) and its past foibles.

In a lengthy blog post Feb. 26, Charles Morris, program manager lead for Project Spartan, admitted that as the IE version numbers crept upward, Microsoft "heard complaints about some sites being broken in IE—from family members, co-workers in other parts of Microsoft, or online discussions." Most of those sites fell outside of the company's Web compatibility target, namely the top 9,000 sites that account for an estimated 88 percent of the world's Web traffic.

As part of a new "interoperability-focused approach," his group decided to take a fork in the path laid out by previous versions of IE. "The break meant bringing up a new Web rendering engine, free from 20 years of Internet Explorer legacy, which has real-world interoperability with other modern browsers as its primary focus—and thus our rallying cry for Windows 10 became 'the Web just works,'" said Morris.

While Project Spartan's new rendering engine has its roots in IE's core HTML rendering component (MSHTML.dll), it "diverged very quickly," he said. "By making this split, we were able to keep the major subsystem investments made over the last several years, while allowing us to remove document modes and other legacy IE behaviors from the new engine."

IE isn't going away, however. "This new rendering engine was designed with Project Spartan in mind, but will also be available in Internet Explorer on Windows 10 for enterprises and other customers who require legacy extensibility support," Morris said.

Morris and his team are also leveraging analytic drawn from "trillions of URLs" and the company's Bing search technology to help inform the browser's development, suggesting that future builds of Project Spartan will be more closely aligned with the Web's evolution and his company's new cloud like approach to software updates.

"For users that upgrade to Windows 10, the engine will be evergreen, meaning that it will be kept current with Windows 10 as a service," he said, referencing the company's ambitious new OS strategy. A revamp of Microsoft's own practices is also helping to bring the team's vision to fruition, Morris revealed.

"In addition, we revised our internal engineering processes to prioritize real-world interoperability issues uncovered by our data analysis. With these processes in place, we set about fixing over 3000 interoperability bugs and adding over 40 new Web standards (to date) to make sure we deliver on our goals," he stated.

WatchGuard M500 Appliance Alleviates HTTPS Performance Woes

$
0
0
WatchGuard aims to alleviate the performance and security issues presented by the broad adoption of HTTPS with the M500 Unified Threat Management Appliance.

HTTPS has become the standard bearer for Web traffic, thanks to privacy concerns, highly publicized network breaches and increased public demand for heightened Web security.

While HTTPS does a great job of encrypting what used to be open Web traffic, the technology does have some significant implications for those looking to keep networks secure and protected from threats.

For example, many enterprises are leveraging unified threat management (UTM) appliances to prevent advanced persistent threats (APTs), viruses, data leakage and numerous other threats from compromising network security. However, HTTPS has the ability to hide traffic via encryption from those UTMs and, in turn, nullifies many of the security features of those devices.

That situation has forced appliance vendors to incorporate a mechanism that decrypts HTTPS traffic and examine the data payloads for problems. On the surface, that may sound like a solution to what should never have been a problem to begin with but, in fact, has created additional pain points for network managers.

Those pain points come in the form of throughput and latency, where a UTM now has to deal with encrypted traffic from hundreds or even thousands of users, straining application-specific ICs (ASICs) to the breaking point and severely degrading the performance of network connections. What’s more, the situation is only bound to get worse as more and more Websites adopt HTTPS and rely on the Secure Sockets Layer (SSL) protocol to keep data encrypted and secure from unauthorized decryption.

Simply put, encryption hampers a UTM’s ability to scan for viruses, spear-phishing attacks, APTs, SQL injection and data leakage, and reduces URL filtering capabilities.

WatchGuard Firebox M500 Tackles the Encryption Conundrum

WatchGuard Technologies, based in Seattle, has been a player in the enterprise security space for some 20 years and has developed numerous security solutions, appliances and devices to combat the ever-growing threats presented by connectivity to the world at large.

The company released the Firebox M500 at the end of November 2014 to address the ever-growing complexity that encryption has brought to enterprise security. While encryption has proven to be very beneficial for enterprise networks trying to protect privacy and prevent eavesdropping, it has also presented a dark side, where malware can be hidden within network traffic and only discovered at the endpoint, often too late.

The Firebox M500 pairs advanced processing power (in the form of multi-core Intel processors) with advanced heuristics to decrypt traffic and examine it for problems, without significantly impacting throughput or hampering latency. The M500 was designed from the outset to deal with SSL and open (clear) traffic using the same security technologies, bringing a cohesive approach to the multitude of security functions the device offers.

The Firebox M500 offers the following security services:

1. APT Blocker: Leverages a cloud-based service featuring a combination of sandboxing and full system emulation to detect and block APTs.

2. Application Control: Allows administrators to keep unproductive, inappropriate, and dangerous applications off limits from end users.

3. Intrusion Prevention Service (IPS): Offers in-line protection from malicious exploits, including buffer overflows, SQL injections and cross-site scripting attacks.

4. WebBlocker: Controls access via policies to sites that host objectionable material or pose network security risks.

5. Gateway AntiVirus (GAV): In-line scan of traffic on all major protocols to stop threats.

6. spamBlocker delivers continuous protection from unwanted and dangerous email.

7. Reputation-enabled defense: Uses cloud-based reputation lookup to promote safer Web surfing.

8. Data loss prevention: Inspects data in motion for corporate policy violations.

WatchGuard uses a subscription-based model that allows users to purchase features based on subscription and license terms. This model creates an opportunity for network administrators to pick and choose only the security services needed or roll out security services in a staggered fashion to ease deployment.

Installation and Setup

The Firebox M500 is housed in a 1u, red metal box that features six 1000/100/10 Ethernet ports, two USB ports, a Console port and a pair of optionally configurable small-form-factor pluggable ports. Under the hood resides an Intel Pentium G3420 processor and 8GB of RAM, as well as the company’s OS, FireWare 11.9.4.

The device uses a “man-in-the-middle” methodology to handle HTTPS traffic, allowing it to decrypt and encrypt traffic destined for endpoints on the network.

That man-in-the-middle approach ensures that all HTTPS (or SSL certificate-based traffic) must pass through the device and become subject to the security algorithms employed. This, in turn, creates an environment where DLP, AV, APT protection and other services can function without hindrance.

Initial deployment consists of little more than placing the M500 in an equipment rack and plugging in the appropriate cables. The device defaults to an open mode for outboard connections that allows all outbound traffic to enable administrators to quickly plug it in without much disruption.

On the other hand, inbound traffic will be blocked until policies are defined to handle that traffic. This can potentially cause some disruption to remote workers or external services until the device is configured.

A configuration wizard guides administrators through the steps to set up the basic security features. While the wizard does a decent job of preventing administrators from disrupting connectivity, there are settings that one must be keenly aware of to maintain efficient performance. The wizard also handles some of the more mundane housekeeping tasks, such as installing licenses, subscriptions, network configurations and so on.

To truly appreciate how the Firebox M500 works and to fully comprehend the complexity of the appliance, one must delve into policy creation and definition. Almost everything that the device does is driven by definable policies that require administrators to carefully consider what traffic should be allowed, should be examined and should be blocked.

Defining policies ranges from the simplistic to the very complex. For example, an administrator can define a policy that blocks Web traffic based on content in a few simple steps. All it takes is clicking on policy creation, selecting a set of predefined rules, applying those rules to users/ports/etc. and then clicking off on the types of content that are not allowed (such as botnets, keyloggers, malicious links, fraud, phishing, etc.).

Policy definition can also be hideously complex, such as with HTTPS proxy definition and the associated certificate management. Although the device steps you through much of the configuration, administrators will have to be keenly aware of exceptions that must be white-listed (depending on their business environment), privacy concerns and a plethora of other issues.

That said, complexity is inherent when it comes to controlling that type of traffic, and introducing simplicity would more than likely unintentionally create either false positives or limit full protection.

Naturally, performance is a key concern when dealing with encrypted traffic, and WatchGuard has addressed that concern by leveraging Intel processors, instead of creating custom ASICs to handle the traffic.

Independent performance testing by Miercom Labs shows that WatchGuard made the right choice by choosing CISC-based CPUs instead of taking a RISC approach. Miercom's testing report shows that the M500 is capable of 5,204M bps of throughput with Firewall services enabled.

For environments that will deploy multiple Firebox M500s across different locations, WatchGuard offers the WatchGuard System Manager, which uses templates for centralized management and offers the ability to distribute policies to multiple devices. That eliminates having to manage each M500 individually, beyond initially plugging in the device.

WatchGuard offers a deployment tool called RapidDeploy, which provides the ability to install a preconfigured/predefined image and associated policies on a freshly deployed device. Simply put, all anyone has to do is plug in the appliance and ensure there is connectivity, and an administrator located anywhere can set up the device in a matter of moments. That proves to be an excellent capability for those managing branch offices, remote workers, multiple sites or distributed enterprises.

The M500 starts at a MSRP of $6,190, (including one year of security services in a discounted bundle). APT services for a year add another $1,375, while a year's worth of DLP services adds another $665. The company offers significant discounts for multiyear subscriptions and also supports a vibrant reseller channel.

While the WatchGuard Firebox M500 may not be the easiest security appliance to deploy, it does offer all the features almost any medium enterprise would want. It also offers a solution to one of the most critical pain points faced by network administrators today—keeping systems secure, even when dealing with encrypted traffic.

How to Quickly Fix Boot Record Errors in Windows

$
0
0
If you have used Windows for a good amount of time, you may have come across boot record errors that prevent your Windows from booting up properly. The reasons for this error could be due to, but not limited to, corrupted or deleted boot files, removing Linux operating system from a dual-boot computer, mistakenly installing the older version of boot record, etc. 

The boot record errors are purely software errors and can be easily corrected using the Windows built-in tools and the installation media.
But the problem is that the Windows operating system doesn’t provide any sort of graphical user interface so as to fix the boot record problems with just a few clicks. So if you ever need to, here is how you can fix the Windows boot record errors by just entering a command or two into the Windows command prompt.

If you have a boot record problem, then you probably won’t be able to reach the Windows desktop and open command prompt from there. In this case, you have to insert the Windows OS installation media and boot from it. At the “Install Now” screen, click on the link “Repair your computer.”


The above action will open the System Recovery Options window. Here select the operating system you want to recover and click on the “Next” button to continue.


Since we need the command prompt to work with, select the option “Command Prompt.”


Note: If you are using Windows 8 or 8.1, then press the F8 or “Shift + F8″ keys on your keyboard while booting, select the option “Troubleshoot -> Advanced Settings” and then again select Command Prompt from the list of the options to open the Command Prompt window.

Note: though I’m showing this on a Windows 7 computer, the procedure is one and the same for Vista and 8/8.1.

Once you are in the command prompt, we can start fixing the boot record error using the bootrec command. Most of the time boot record problems are a direct result of damaged or corrupted Master Boot Record. In those scenarios, simply use the below command to quickly fix the Master Boot Record.

bootrec /fixmbr
 
 
Once you execute the command, you will receive a confirmation message letting you know, and you can continue to log in to your Windows machine.

If you think your boot sector is either damaged or replaced by the other boot loaders, then use the below command to erase the existing one and create a new boot sector.

bootrec /fixboot
 
 
Besides corrupted boot records, boot record errors may also occur when the “Boot Configuration Data” has been damaged or corrupted. In those cases, you need to use the following command to rebuild the Boot Configuration Data. If the BCD is actually corrupted or damaged, Windows will display the identified Windows installations to rebuild the entire BCD.

bootrec /rebuildbcd
 
 
If you have installed multiple operating systems on your Windows machine then you might want to use the “ScanOS” argument. This parameter commands Windows to scan and add all the missing operating systems to the Boot Configuration Data. This enables the user to choose an operating system while booting.

bootrec /scanos
 
 
That’s all there is to do, and it is that simple to fix boot record errors in the Windows operating system.

How to bypass iPhone, iPad, iPod with iCloud Bypass DNS Server

$
0
0

How to connect your iDevice to iCloud Bypass DNS Server

Follow the below step by step instruction in screenshots to use your iCloud locked device to watch videos, take pictures, listen music and much more, while you are waiting full bypass.


How To Activate WhatsApp Calling For Android

$
0
0
Get the latest WhatsApp for Android
WhatsApp Calling, the new invitation-only feature of WhatsApp that adds free phone call capabilities to the app that was previously only capable of messaging, has officially been launched.

The feature can be accessed by users running WhatsApp version 2.12.10 or  2.11.528 from the Google Play Store, or version 2.11.531 if downloaded directly from the official website of WhatsApp.


The rollout of the feature was first tested by WhatsApp in India early last month, with the feature then already tagged as an invitation-only. Users that wish to test the WhatsApp call feature first had to receive a call from another user to activate the feature, even if the user already had the latest version of WhatsApp installed.

With the official launch of WhatsApp Calling, the process of triggering the feature to be activated is to receive a call from another WhatsApp user that already has the feature unlocked, showing no change to the process that was implemented for WhatsApp Calling's testing. However, if the user being called up does not have the latest version of WhatsApp installed, a notification will be sent to request the user to update the app before the call is made.

According to Android news website Android Police, after a user receives a call from another WhatsApp user with the WhatsApp Calling feature already activated, the user interface for the app changes, either instantly or after the user closes and then re-opens WhatsApp. The new user interface displays three tabs, labeled as calls, chats and contacts.

The call feature has been integrated well into WhatsApp, with the tab for WhatsApp Calling showing all incoming, outgoing and missed calls with their exact times. Calls that are ongoing are placed in the app's notification panel until the call is ended, and calls that are missed leave notifications that can later be checked by the user. While in a call, users can choose to mute their microphones or to turn on the loudspeaker.

Accessing the call feature can be done through the messages with any of the user's contact, as a call button will appear as one of the options in the action bar for that user beside the attach option and the menu.

Users that tap on the avatar of a contact will also be shown a profile image of the user that is bigger in size, with options of either sending them a message or calling them displayed, along with viewing their information.

The call button for contacts now leads by default to a WhatApp call, as opposed to a smartphone call in the past.

How to enable WhatsApp voice calls (with root)

In case none of this is still working for you, there is another way for rooted users to force the feature onto their phones, but it is a bit of a pain, as you’ll need to be connected to your PC and open a terminal every time you want to WhatsApp call someone (until it is enabled permanently for you).
Just open a terminal emulator and enter the following command:

su -c am start -n com.whatsapp/com.whatsapp.HomeActivity

Have you got the feature yet? Will you now turn to WhatsApp as your default dialer?

Oracle Database 12c Release 1 (12.1) RAC On Windows 2012 Step By Step Installation

$
0
0

This article describes the installation of Oracle Database 12c Release 1 (12.1) RAC on Windows 2012 Server Standard Edition using virtual environment with no additional shared disk devices.


  • Introduction
  • Download Software
  • VirtualBox Installation
  • Virtual Machine Setup
  • Guest Operating System Installation
  • Oracle Installation Prerequisites
  • Create Shared Disks
  • Clone the Virtual Machine
  • Install the Grid Infrastructure
  • Install the Database Software and Create a Database
  • Check the Status of the RAC


Introduction

One of the biggest obstacles preventing people from setting up test RAC environments is the requirement for shared storage. In a production environment, shared storage is often provided by a SAN or high-end NAS device, but both of these options are very expensive when all you want to do is get some experience installing and using RAC. A cheaper alternative is to use a FireWire disk enclosure to allow two machines to access the same disk(s), but that still costs money and requires two servers. A third option is to use virtualization to fake the shared storage.

Using VirtualBox you can run multiple Virtual Machines (VMs) on a single server, allowing you to run both RAC nodes on a single machine. In additon, it allows you to set up shared virtual disks, overcoming the obstacle of expensive shared storage.


Before you launch into this installation, here are a few things to consider.
  • The finished system includes the host operating system, two guest operating systems, two sets of Oracle Grid Infrastructure (Clusterware + ASM) and two Database instances all on a single server. As you can imagine, this requires a significant amount of disk space, CPU and memory.
  • Following on from the last point, the VMs will each need at least 3G of RAM, preferably 4G if you don't want the VMs to swap like crazy. Don't assume you will be able to run this on a small PC or laptop. You won't.
  • This procedure provides a bare bones installation to get the RAC working. There is no redundancy in the Grid Infrastructure installation or the ASM installation. To add this, simply create double the amount of shared disks and select the "Normal" redundancy option when it is offered. Of course, this will take more disk space.
  • During the virtual disk creation, I always choose not to preallocate the disk space. This makes virtual disk access slower during the installation, but saves on wasted disk space. The shared disks must have their space preallocated.
  • This is not, and should not be considered, a production-ready system. It's simply to allow you to get used to installing and using RAC.
  • The Single Client Access Name (SCAN) should be defined in the DNS or GNS and round-robin between one of 3 addresses, which are on the same subnet as the public and virtual IPs. Prior to 11.2.0.2 it could be defined as a single IP address in the "/etc/hosts" file, which is wrong and will cause the cluster verification to fail, but it allowed you to complete the install without the presence of a DNS. This does not seem to work for 11.2.0.2 onward.
  • The virtual machines can be limited to 2Gig of swap, which causes a prerequisite check failure, but doesn't prevent the installation working. If you want to avoid this, define 3+Gig of swap.
  • This article uses the 64-bit versions of Windows and Oracle 11g Release 2.
  • In this article I am using a Oracle Linux as my host OS.


Download Software

Download the following software.


VirtualBox Installation

First, install the VirtualBox software. On RHEL and its clones you do this with the following command as the root user.
# rpm -Uvh VirtualBox-4.2-4.2.16_86992_el6-1.x86_64.rpm
The package name will vary depending on the host distribution you are using. Once complete, VirtualBox is started from the menu.


Virtual Machine Setup

Now we must define the two virtual RAC nodes. We can save time by defining one VM, then cloning it when it is installed.

Start VirtualBox and click the "New" button on the toolbar. Enter the name "w2012-121-rac1", OS "Microsoft Windows" and Version "Windows 2012 (64 bit)", then click the "Next" button.


Enter "4096" as the base memory size, then click the "Next" button.


Accept the default option to create a new virtual hard disk by clicking the "Create" button.


Accept the default hard drive file type by clicking the "Next" button.


Accept the "Dynamically allocated" option by clicking the "Next" button.


Accept the default location and set the size to "30G", then click the "Create" button. If you can spread the virtual disks onto different physical disks, that will improve performance.


The "w2012-121-rac1" VM will appear on the left hand pane. Scroll down the details on the right and click on the "Network" link.


Make sure "Adapter 1" is enabled, set to "Bridged Adapter", then click on the "Adapter 2" tab.


Make sure "Adapter 2" is enabled, set to "Internal Network", then click on the "System" section.


Move "Hard Disk" to the top of the boot order and uncheck the "Floppy" option, then click the "OK" button.


The virtual machine is now configured so we can start the guest operating system installation.

Guest Operating System Installation

With the new VM highlighted, click the "Start" button on the toolbar. On the "Select start-up disk" screen, choose the relevant Oracle Linux ISO image and click the "Start" button.


The resulting console window will contain the Windows 2012 boot screen.


Continue through the Full Standard Edition installation as you would for a normal server. In this case I was using an evaluation version of Windows 2012, so I picked the "Windows Server 2012 Standard Evaluation (Server with a GUI)" option. Pick the custom install when doing a fresh installation.

When the installation is complete, install the VirtualBox Guest Additions on the server. This is initiated from the "Devices > Install Guest Additions..." menu. Accept all the defaults and reboot the server when requested.

Create a shared folder (Devices > Shared Folders) on the virtual machine, pointing to the directory on the host where the Oracle software was unzipped. Check the "Auto-mount" and "Make Permanent" options before clicking the "OK" button.


The VM will need to be restarted for the guest additions to be used properly. The next section requires a shutdown so no additional restart is needed at this time. Once the VM is restarted, the shared folder will be available as the "E:\" drive.

Oracle Installation Prerequisites

Perform the following steps whilst logged into the virtual machine.
Turn off the Windows firewall "Server Manager > Local Server > Windows Firewall > Public:On > Turn Windows Firewall on or off" to prevent it from interfering with the sever communication. You can turn it on later and open up any required ports if you want to.

Amend the "C:\windows\system32\drivers\etc\hosts" file to contain the following information. Even if you are using DNS to resolve the SCAN, include the SCAN entries in the "hosts" files. Without them the installer had trouble recognising the SCAN.
127.0.0.1       localhost.localdomain   localhost
# Public
192.168.0.151 w2012-121-rac1.localdomain w2012-121-rac1
192.168.0.152 w2012-121-rac2.localdomain w2012-121-rac2

# Private
192.168.1.151 w2012-121-rac1-priv.localdomain w2012-121-rac1-priv
192.168.1.152 w2012-121-rac2-priv.localdomain w2012-121-rac2-priv

#Virtual
192.168.0.153 w2012-121-rac1-vip.localdomain w2012-121-rac1-vip
192.168.0.154 w2012-121-rac2-vip.localdomain w2012-121-rac2-vip

# SCAN
192.168.0.155 w2012-121-scan.localdomain w2012-121-scan
192.168.0.156 w2012-121-scan.localdomain w2012-121-scan
192.168.0.157 w2012-121-scan.localdomain w2012-121-scan
Open the "Network Connections" screen (Server Manager > Local Server > Ethernet (click link next to it)). Rename the "Ethernet" to "public" and "Ethernet 2" to "private", making sure you apply the names to the appropriate connections. You can do this by right-clicking on the connection and selecting "Rename" from the pop-up menu.

Set the correct IP information for the public and private connections. Right-click on a connection and select the "Properties" menu option. Click on "Internet Protocol Version 4 (TCP/IPv4)" option and click the "Properties. button. Enter the appropriate IP, subnet, default gateway and DNS for the networks.

public:
  • IP Address: 192.168.0.151
  • Subnet: 255.255.255.0
  • Default Gateway: 192.168.0.1
  • DNS: 192.168.0.6
private:
  • IP Address: 192.168.1.151
  • Subnet: 255.255.255.0
  • Default Gateway: N/A
  • DNS: N/A
Click on the "Advanced" button, followed by the "DNS" tab. Select the "Append these DNS suffixes (in order)" option and add the domain suffix, in this case "localdomain". Use the "OK" buttons to exit the dialogs.

Note. It's worth double-checking the MAC addresses of the network adapters in the VM against those of the network interfaces on the guest operating system. Make sure the public interface is the bridged connection. The guest OS sometimes shows the interfaces out of order.

If any of the network connections are left in a disabled state, right-click on then and select the "Diagnose" option to repair them.

Ensure the public interface is first in the bind order:
  • On the "Network Connections" dialog, press "Alt+N" to show the advanced menu. Select "Advanced Settings...".
  • On the "Adapters and Bindings" tab, make sure the public interface is the first interface listed.
  • Click on each network in turn and make sure the "TCP/IPv4" bindings come before the "TCP/IPv6" bindings. This should be correct by default.
  • Accept any modifications by clicking on the "OK" button and exiting the "Network Connections" dialog.
Disable Windows Media Sensing for TCP/IP:
  • Backup the Windows registry.
  • Run the Registry Editor (Regedit.exe) and find the following key.
    HKEY_LOCAL_MACHINE\SYSTEM\CurrentControlSet\Services\Tcpip\Parameters
  • Add the following registry value.
    Value Name: DisableDHCPMediaSense
    Data Type: DWORD
    Value: 1
  • This change will not take effect until the computer is restarted.
Open the "System Properties" dialog (Start > Control Panel > System and Security > System > Change Settings) and do the following:
  • Click the "Change" button, enter the machine name "w2012-121-rac1" then click the "OK" button.
  • Click on the Advanced tab and the "Environment Variables" button.
  • Edit both the "TEMP" and "TMP" environment variables to be "%WINDIR%\temp", which is "C:\Windows\temp".
  • Click the "OK" button and "Apply" out of the "System" dialog.
Restart the server.

Create Shared Disks

Make sure the VM is shutdown, create a directory to host the shared virtual disks on the host OS, then create the shared disks. My host is Linux, so the paths to the virtual disks are UNIX-style paths. If your host is Windows, then you will be using Windows-style paths.


mkdir -p /u04/VirtualBox/w2012-121-rac
cd /u04/VirtualBox/w2012-121-rac

# Create the disks and associate them with VirtualBox as virtual media.
VBoxManage createhd --filename asm1.vdi --size 5120 --format VDI --variant Fixed
VBoxManage createhd --filename asm2.vdi --size 5120 --format VDI --variant Fixed
VBoxManage createhd --filename asm3.vdi --size 5120 --format VDI --variant Fixed
VBoxManage createhd --filename asm4.vdi --size 5120 --format VDI --variant Fixed

# Connect them to the VM.
VBoxManage storageattach w2012-121-rac1 --storagectl "SATA" --port 1 --device 0 --type hdd --medium asm1.vdi --mtype shareable

VBoxManage storageattach w2012-121-rac1 --storagectl "SATA" --port 2 --device 0 --type hdd --medium asm2.vdi --mtype shareable

VBoxManage storageattach w2012-121-rac1 --storagectl "SATA" --port 3 --device 0 --type hdd --medium asm3.vdi --mtype shareable

VBoxManage storageattach w2012-121-rac1 --storagectl "SATA" --port 4 --device 0 --type hdd --medium asm4.vdi --mtype shareable

# Make shareable.
VBoxManage modifyhd asm1.vdi --type shareable
VBoxManage modifyhd asm2.vdi --type shareable
VBoxManage modifyhd asm3.vdi --type shareable
VBoxManage modifyhd asm4.vdi --type shareable

Start the w2012-121-rac1 virtual machine by clicking the "Start" button on the toolbar. When the server has started, log in so you can partition the disks.

We will partition the disks using the "DiskPart" utility. To get alist of the current disks do the following.
C:\>diskpart

Microsoft DiskPart version 6.0.6001
Copyright (C) 1999-2007 Microsoft Corporation.
On computer: RAC1

DISKPART> list disk

Disk ### Status Size Free Dyn Gpt
-------- ---------- ------- ------- --- ---
Disk 0 Online 30 GB 0 B
Disk 1 Online 10 GB 10 GB
Disk 2 Online 10 GB 10 GB
Disk 3 Online 10 GB 10 GB
Disk 4 Online 10 GB 10 GB

DISKPART>
In the diskpart utility we will perform the following commands.
automount enable
select disk 1
create partition extended
create partition logical
select disk 2
create partition extended
create partition logical
select disk 3
create partition extended
create partition logical
select disk 4
create partition extended
create partition logical
exit
Stamp the disks for use with ASM. This is done using the asmtool that comes with the Grid Infrastructure media.
C:> E:
E:> cd grid\asmtool
E:> asmtool -add \Device\HardDisk1\Partition1 ORCLDISK1
E:> asmtool -add \Device\HardDisk2\Partition1 ORCLDISK2
E:> asmtool -add \Device\HardDisk3\Partition1 ORCLDISK3
E:> asmtool -add \Device\HardDisk4\Partition1 ORCLDISK4

E:> asmtool -list

NTFS \Device\Harddisk0\Partition1 350M
NTFS \Device\Harddisk0\Partition2 30368M
ORCLDISK1 \Device\Harddisk1\Partition1 5117M
ORCLDISK2 \Device\Harddisk2\Partition1 5117M
ORCLDISK3 \Device\Harddisk3\Partition1 5117M
ORCLDISK4 \Device\Harddisk4\Partition1 5117M

E:>
The shared disks are now configured.

Clone the Virtual Machine

VirtualBox allows you to clone VMs, but these also attempt to clone the shared disks, which is not what we want. Instead we must manually clone the VM.

Shutdown the "w2012-121-rac1" VM.

Manually clone the virtual disk using the following commands on the host server.

mkdir -p /u03/VirtualBox/w2012-121-rac2

VBoxManage clonehd /u02/VirtualBox/w2012-121-rac1/w2012-121-rac1.vdi /u03/VirtualBox/w2012-121-rac2/w2012-121-rac2.vdi


Create the "w2012-121-rac2" virtual machine in VirtualBox in the same way as you did for "w2012-121-rac1", with the exception of using an existing "w2012-121-rac2.vdi" virtual hard drive.
Remember to add the three network adaptors as you did on the first VM. When the VM is created, attach the shared disks to this VM.

cd /u04/VirtualBox/w2012-121-rac

VBoxManage storageattach w2012-121-rac2 --storagectl "SATA" --port 1 --device 0 --type hdd --medium asm1.vdi --mtype shareable

VBoxManage storageattach w2012-121-rac2 --storagectl "SATA" --port 2 --device 0 --type hdd --medium asm2.vdi --mtype shareable

VBoxManage storageattach w2012-121-rac2 --storagectl "SATA" --port 3 --device 0 --type hdd --medium asm3.vdi --mtype shareable

VBoxManage storageattach w2012-121-rac2 --storagectl "SATA" --port 4 --device 0 --type hdd --medium asm4.vdi --mtype shareable


Start the "w2008-112-rac2" virtual machine.

Open the "Network Connections" screen (Server Manager > Local Server > Ethernet (click link next to it)) and amend the IP address values of each network to the appropriate values for the second node.
Open the "System Properties" dialog (Start > Control Panel > System and Security > System > Change Settings) and change the machine name by clicking the "Change" button. Click all "OK" buttons to exit the "System Properties" dialog and restart the server when prompted.

Once the RAC2 virtual machine has restarted, start the RAC1 virtual machine. When both nodes have started, check they can both ping all the public and private IP addresses using the following commands.
ping w2012-121-rac1
ping w2012-121-rac1-priv
ping w2012-121-rac2
ping w2012-121-rac2-priv
At this point the virtual IP addresses defined in the hosts file will not work, so don't bother testing them.

The virtual machine setup is now complete.

Before moving forward you should probably shut down your VMs and take snapshots of them. If any failures happen beyond this point it is probably better to switch back to those snapshots, clean up the shared drives and start the grid installation again. An alternative to cleaning up the shared disks is to back them up now using zip and just replace them in the event of a failure.
$ cd /u04/VirtualBox/w2012-121-rac
$ zip PreGrid.zip *.vdi

Install the Grid Infrastructure

Make sure both virtual machines are started. Login to "w2012-121-rac1" and start the Oracle installer.
e:
cd grid
setup.exe
Select the "Skip software updates" option, then click the "Next" button.


Select the "Install and Configure Oracle Grid Infrastructure for a Cluster" option, then click the "Next" button.


Select the "Typical Installation" option, then click the "Next" button.


On the "Specify Cluster Configuration" screen, enter the correct SCAN Name and click the "Add" button.


Enter the details of the second node in the cluster, then click the "OK" button.


Click the "Identify network interfaces..." button and check the public and private networks are specified correctly. Remember to mark the NAT interface as "Do Not Use". Once you are happy with them, click the "OK" button and the "Next" button on the previous screen.


Enter the ORACLE_BASE of "c:\app\12.1.0.1", a software location of "c:\app\12.1.0.1\grid" and the SYSASM password. click the "Next" button.


Set the redundancy to "External", select all 4 disks and click the "Next" button.


Wait while the prerequisite checks complete. If you have any issues, either fix them or check the "Ignore All" checkbox and click the "Next" button. It is likely the "Windows firewall status", "Physical Memory" and "Administrator" tests will fail for this type of installation.


If you are happy with the summary information, click the "Install" button.


Wait while the setup takes place.


Click the "Close" button to exit the installer.


The grid infrastructure installation is now complete. We can check the status of the installation using the following commands.
C:\>C:\app\12.1.0.1\grid\bin\crsctl stat res -t
--------------------------------------------------------------------------------
Name Target State Server State details
--------------------------------------------------------------------------------
Local Resources
--------------------------------------------------------------------------------
ora.DATA.dg
ONLINE ONLINE w2012-121-rac1 STABLE
ONLINE ONLINE w2012-121-rac2 STABLE
ora.LISTENER.lsnr
ONLINE ONLINE w2012-121-rac1 STABLE
ONLINE ONLINE w2012-121-rac2 STABLE
ora.asm
ONLINE ONLINE w2012-121-rac1 Started,STABLE
ONLINE ONLINE w2012-121-rac2 Started,STABLE
ora.net1.network
ONLINE ONLINE w2012-121-rac1 STABLE
ONLINE ONLINE w2012-121-rac2 STABLE
ora.ons
ONLINE ONLINE w2012-121-rac1 STABLE
ONLINE ONLINE w2012-121-rac2 STABLE
--------------------------------------------------------------------------------
Cluster Resources
--------------------------------------------------------------------------------
ora.LISTENER_SCAN1.lsnr
1 ONLINE ONLINE w2012-121-rac2 STABLE
ora.LISTENER_SCAN2.lsnr
1 ONLINE ONLINE w2012-121-rac1 STABLE
ora.LISTENER_SCAN3.lsnr
1 ONLINE ONLINE w2012-121-rac1 STABLE
ora.cvu
1 ONLINE ONLINE w2012-121-rac1 STABLE
ora.oc4j
1 OFFLINE OFFLINE STABLE
ora.scan1.vip
1 ONLINE ONLINE w2012-121-rac2 STABLE
ora.scan2.vip
1 ONLINE ONLINE w2012-121-rac1 STABLE
ora.scan3.vip
1 ONLINE ONLINE w2012-121-rac1 STABLE
ora.w2012-121-rac1.vip
1 ONLINE ONLINE w2012-121-rac1 STABLE
ora.w2012-121-rac2.vip
1 ONLINE ONLINE w2012-121-rac2 STABLE
--------------------------------------------------------------------------------

C:\>
At this point it is probably a good idea to shutdown both VMs and take snapshots. Remember to make a fresh zip of the ASM disks on the host machine, which you will need to restore if you revert to the post-grid snapshots.
$ cd /u04/VirtualBox/w2012-121-rac
$ zip PostGrid.zip *.vdi

Install the Database Software

Make sure the "w2012-121-rac1" and "w2012-121-rac2" virtual machines are started, then login to "w2012-121-rac1" and start the Oracle installer.
e:
cd database
setup.exe
Uncheck the security updates checkbox and click the "Next" button and "Yes" on the subsequent warning dialog.


Check the "Skip software updates" checkbox and click the "Next" button.


Select the "Install database software only" option, then click the "Next" button.


Accept the "Oracle Real Application Clusters database installation" option by clicking the "Next" button.


Make sure both nodes are selected, then click the "Next" button.


Select the required languages, then click the "Next" button.


Select the "Enterprise Edition" option, then click the "Next" button.


Decide the credentials for the database user, then click the "Next" button. In this case I picked the "Use Windows Built-in Account" option, which is not recommended. If you pick this option, accept the following warning dialog.


Enter "c:\app\oracle" as the Oracle base and "c:\app\oracle\product\12.1.0.1\db_1" as the software location, then click the "Next" button.


Wait for the prerequisite check to complete. If there are any problems either fix them, or check the "Ignore All" checkbox and click the "Next" button.


If you are happy with the summary information, click the "Install" button.


Wait while the installation takes place.


Click the "Close" button to exit the installer.


Shutdown both VMs and take snapshots. Remember to make a fresh zip of the ASM disks on the host machine, which you will need to restore if you revert to the post-db snapshots.
$ cd /u04/VirtualBox/w2012-121-rac
$ zip PostDB.zip *.vdi

Create a Database

Make sure the "w2012-121-rac1" and "w2012-121-rac2" virtual machines are started, then login to "w2012-121-rac1" and start the Database Creation Asistant (DBCA).
c:\>dbca
Select the "Create Database" option and click the "Next" button.

Select the "Create a database with default configuration" option. Enter the container database name (cdbrac), pluggable database name (pdbrac) and administrator password. Click the "Next" button.


Wait for the prerequisite checks to complete. If there are any problems either fix them, or check the "Ignore All" checkbox and click the "Next" button.


If you are happy with the summary information, click the "Finish" button.


Wait while the database creation takes place.


If you want to modify passwords, click the "Password Management" button. When finished, click the "Exit" button.


Click the "Close" button to exit the DBCA.


The RAC database creation is now complete.

Check the Status of the RAC

There are several ways to check the status of the RAC. The srvctl utility shows the current configuration and status of the RAC database.
C:\>srvctl config database -d cdb12c
Database unique name: cdb12c
Database name: cdb12c
Oracle home: C:\app\oracle\product\12.1.0.1\db_1
Oracle user: nt authority\system
Spfile: +DATA/cdb12c/spfilecdb12c.ora
Password file: +DATA/cdb12c/orapwcdb12c
Domain:
Start options: open
Stop options: immediate
Database role: PRIMARY
Management policy: AUTOMATIC
Server pools: cdb12c
Database instances: cdb12c1,cdb12c2
Disk Groups: DATA
Mount point paths:
Services:
Type: RAC
Start concurrency:
Stop concurrency:
Database is administrator managed

C:\>

C:\>srvctl status database -d cdb12c
Instance cdb12c1 is running on node w2012-121-rac1
Instance cdb12c2 is running on node w2012-121-rac2

C:\>
The V$ACTIVE_INSTANCES view can also display the current status of the instances.
C:\>sqlplus / as sysdba

SQL*Plus: Release 12.1.0.1.0 Production on Mon Jul 22 23:12:22 2013

Copyright (c) 1982, 2013, Oracle. All rights reserved.


Connected to:
Oracle Database 12c Enterprise Edition Release 12.1.0.1.0 - 64bit Production
With the Partitioning, Real Application Clusters, Automatic Storage Management,
Advanced Analytics and Real Application Testing options

SQL> SELECT inst_name FROM v$active_instances;

INST_NAME
------------------------------------------------------------
W2012-121-RAC1:cdb12c1
W2012-121-RAC2:cdb12c2

SQL>

If you have any question or suggestion, please feel free to leave your comments below and we will try to answer your queries at our leisure.

Adaptive SQL Plan Management (SPM) in Oracle Database 12c Release 1 (12.1)

BlackBerry launches encrypted enterprise messaging service BBMProtected for iOS

$
0
0

BlackBerry today announced that it is bringing BBM Protected — its enterprise-grade encrypted messaging service — to BBM for iOS.

The keys to encrypt messages in BBM Protected will be generated on the iPhone device itself. This prevents any “‘man in the middle’ hacker attacks, providing greater security than competing encryption schemes, and earning BBM Protected FIPS 140-2 validation by the U.S. Department of Defense.”


The feature can be easily deployed in enterprises that already use BBM for communication, and does not require any additional setup or OS upgrade on their side.

BBM Protected users can start a chat with other BBM Protected users in their organisation as well as outside of it. In case the recipient (or sender) does not use BBM Protected, the other party in the conversation can still initiate an encrypted and trusted chat environment.

BBM Protected is a paid service, though BlackBerry is offering a free 30-day trial to enterprises. It is also available for Android and BlackBerry OS 10 running devices.

Google adds ‘On-body detection’ Smart Lock mode to Android Lollipopdevices

$
0
0

Google seems to be rolling out a new ‘Smart Lock’ feature for Android devices running Lollipop — On-body detection. This new feature will only lock your device when it is sitting on a table or in your pocket.

The feature will make use of the accelerometer on your Android device to detect any movement. In case it does not detect any movement, it will automatically lock your device. But if you are holding the device in your hand and it is already unlocked, On-body will keep it unlocked.


In case you hand over your device to someone while it is unlocked, On-body will keep it unlocked. The feature cannot determine who is holding the device, it only knows that someone is holding it and thus keeps it unlocked.

Google is rolling out the feature only to selected users for now, but it is likely that a wider rollout will start within the next few weeks. For now, the feature has only shown up on Nexus devices, but it is likely that Google will roll it out to other Android devices running Lollipop as well.


iPhone’s Passcode Bypassed Using Software-Based Bruteforce Tool

$
0
0
Last week, a blogger reported on a $300 device called the IP Box, which was allowing repair shops and hackers to bypass passcodes and gain access to locked iOS devices. But it turns out that expensive hardware isn’t required; TransLock, a new utility for Mac, can do the same job over USB.

MDSec’s video proved that the IP Box was able to bypass an iOS passcode using brute-force and maintain the data on an iPhone, iPad, or iPod touch even when the device is set to erase itself automatically when an incorrect passcode has been entered ten times.


But developer Majd Alfhaily, creator of the Freemanrepo that hosts many popular jailbreak tweaks, has been able to replicate a similar brute-force attack using only an application running on a Mac.

“I tried to replicate the attack while covering the entire process without using hardware hacks,” Alfhaily explains in a post on his blog. He built an app called TransLock, which tries every possible 4-digit passcode starting from 0000 and ending at 9999.

TransLock isn’t just cheaper than the IP Box, but it’s faster, too. It takes just 5 seconds for the app to try each passcode, which means it would take 14 hours to try every single combination. The IP Box takes 40 seconds to try each one, which means it could take up to 110 hours.

Alfhaily explains how the whole things works on his blog, so if you’re into code, you can get more details there. But for the rest of us, the demonstration video below shows how TransLock works.

Despite the security concerns, Alfhaily has no plans to keep TransLock to himself. “I’m working on a Mac utility that’ll automate the entire process and send the library to the device over a USB connection,” he writes. “I have plans to release it in the near future.”

Unlike IP Box, however, TransLock will only work on a jailbroken iOS device, so those that haven’t been hacked are safe. In addition, it works with 4-digit passcodes only, so you can use a more complex password if you’re really worried about the vulnerability.

It’s certainly concerning that iOS can be vulnerable to hacks like this, but this is exactly why Apple is against jailbreaking. But as for the IP Box, the Cupertino company will surely have to find a fix for that before the device becomes more popular.
Viewing all 880 articles
Browse latest View live