
Grafana is an open source data visualization and monitoring tool. It offers support for Graphite, Elasticsearch, Included, Prometheus, and many more databases. The Grafana suite comes with a informative dashboard and metric analytics, allows you to manage and create your own dashboard for your apps or infrastructure performance monitoring.
In this guide, we'll show you how to install and configure Grafana on Ubuntu 17.10 server. These steps can also be performed on earlier release of Ubunut.
Prerequisites
- Ubuntu Server 17.10 with root privileges
Install Grafana
Grafana provides two methods for installation - using the downloaded Debian package and using the apt repository. For this guide, we will use apt repository installation.To begin, connect to the Ubuntu server using ssh protocol.
ssh root@your_ubuntu_server_ip
Add new Grafana repository to the 'sources.list.d' directory and then add the repository gpg key using the following commands.
echo 'deb https://packagecloud.io/grafana/stable/debian/ jessie main'> /etc/apt/sources.list.d/grafana.list
curl https://packagecloud.io/gpg.key | sudo apt-key add -
Now, update repository and install Grafana using the following apt commands.
sudo apt update
sudo apt install grafana
After the Grafana installation, you need to reload systemd manager configuration, in order to start Grafana service.
systemctl daemon-reload
Start Grafana and enable it to run automatically at system boot everytime.
systemctl start grafana-server
systemctl enable grafana-server
By default, Grafana will use port 3000. Check it using the netstat command and make sure that the port 3000 is on the 'LISTEN' state list.
netstat -plntu
If you have the UFW firewall installed on the server, open the ssh service port, grafana port 3000, and then start the firewall using the following commands.
ufw allow ssh
ufw allow 3000/tcp
ufw enable
Type 'y' to continue to start and add UFW to run automatically at boot time.
To see the firewall status, run the command below.
ufw status
Grafana has been installed and running on Ubuntu 17.10 server.
Change Grafana Default Password
After Grafana is installed on your server, open up web-browser and type the grafana server IP address with port 3000.http://your_ubuntu_server_ip:3000/
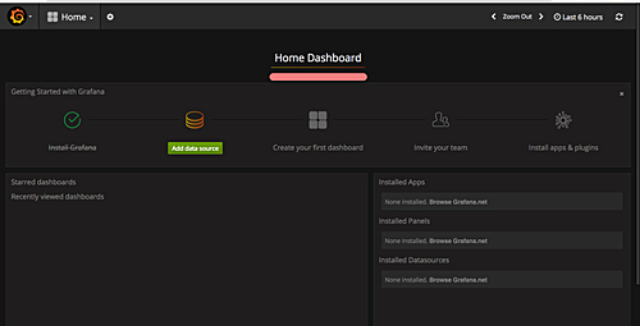
Log in to the Grafana Dashboard using default user 'admin' and password 'admin'.

You will see Grafana Dashboard as shown below.
To change the default username and password for Grafana, click on the Grafana logo on the top left and then click the 'Admin' menu, then choose the 'Global Users'.
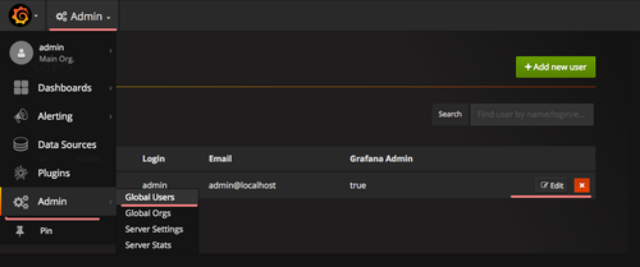
You will see the list of users. Click on 'Edit' menu to edit the username and password. Type your new username and password, click on the green 'Update' button to confirm.

Install Grafana plugins
Following are the Grafana plugins:1.Panel plugins - allow new data visualization to be added to Grafana.
2.Data Source - Grafana Data Source plugins.
3.App - bundles of panels, data source, dashboard with new UI.
For plugin installation, Grafana provides a command line tool called 'grafana-cli'. Run it to see the instruction.
grafana-cli
To get a list of all available plugins in the repository, use the following command.
grafana-cli plugins list-remote
To install a plugin, use 'plugins install' option as shown below.
grafana-cli plugins install grafana-clock-panel
After the plugin installed, restart the Grafana service.
systemctl restart grafana-server
To get a list of all installed plugins on your system, use the following command.
grafana-cli plugins ls
And if you want to remove a plugin, use 'plugins remove' option as below.
grafana-cli plugins remove grafana-clock-panel
Conclusion
We have completed Grafana installation on Ubuntu 17.10 server including its plugins installation. Now you can proceed adding the data sources.