Netdata is an real time performance monitoring tool which provides accurate performance monitoring through its comprehensive web dashboards that visualize the processes and services running on your Linux Servers. It also monitors metrics about CPU, Memory, Disks, Networks, Processes, and lots more.
This guide will walk you through the steps to set up Netdata using its built-in web server or, optionally, using Nginx on Ubuntu 16.04 server.
Prerequisites
To follow the steps mentioned in this article, you will need:
- One Ubuntu 16.04 Server installed on either (physical or virtual) machine with a sudo non-root user and a firewall.
- Git installed on your Ubuntu 16.04 server.
Installing Netdata
Before we begin installation, make sure the system package index is up to date with the following command:
sudo apt-get update
Now, we will install Netdata's dependencies, which include the gcc (a C compiler), GNU Autoconf tools, GUID management, and compression libraries for Netdata's internal web server using the following command:
sudo apt-get install zlib1g-dev uuid-dev libmnl-dev gcc make autoconf autoconf-archive autogen automake pkg-config curl
These set of packages are optional but recommended by Netdata, and include Python, some Python packages, and Node.JS. The stable version of Node.js bundled with the system package manager is fine for Netdata's requirements. Install them with the following command:
sudo apt-get install python python-yaml python-mysqldb python-psycopg2 nodejs lm-sensors netcat
To begin instalation of Netdata itself, we must use the project's GitHub repository. Clone the Netdata repository into your Ubuntu's home directory.
git clone https://github.com/firehol/netdata.git --depth=1 ~/netdata
Next, Move to the newly cloned directory.
cd ~/netdata
Lets build and install the application using the netdata-installer.sh shell script in this directory. Make sure to append sudo here, otherwise the way in which Netdata collects system data (through data collectors) would not function properly.
sudo ./netdata-installer.sh
The output you'll see at first contains information on where Netdata will store all of it's components. You can read through these so you are a bit more familiar with how the program is spread out over the filesystem after its installation.
Installer Output
. . .
It will be installed at these locations:
- the daemon at /usr/sbin/netdata
- config files at /etc/netdata
- web files at /usr/share/netdata
- plugins at /usr/libexec/netdata
- cache files at /var/cache/netdata
- db files at /var/lib/netdata
- log files at /var/log/netdata
- pid file at /var/run
. . .
Hit Enter to continue with the installation. After a moment, at the end of the output you'll see the following message:
Installer Output
. . .
^
|.-. .-. .-. .-. .-. . netdata .-. .-
| '-' '-' '-' '-' '-' is installed and running now! -' '-'
+----+-----+-----+-----+-----+-----+-----+-----+-----+-----+-----+-----+--->
enjoy real-time performance and health monitoring...
Congrats, Netdata is now installed and running successfully, and will run automatically upon rebooting the server as well.
If you have UFW enabled, you'll need to open port 19999 for Netdata's internal web server.
sudo ufw allow 19999/tcp
At this stage, you can view the default dashboard by visiting http://ubuntu_server_ip:19999/ in your favorite browser. Here, You'll see an overview of the system's live metrics. This is a good check that everything's working so far, but before we explore the GUI, let's customize Netdata.
Configuring Netdata's Memory Usage
You can explore Netdata's current configuration in your browser by visiting http://ubuntu_server_ip:19999/netdata.conf.
you can see here that all or most of the configurable options are commented out (i.e. prefaced with a #). This is due to Netdata's configuration works by using a set of assumed defaults. Any disabled settings use Netdata's default value; if a setting is uncommented, the value specified will override the default. This keeps the configuration file contained to only what you've changed.
Lets get back to server, the configuration file itself is /etc/netdata/netdata.conf . The option we'll customize in this article is the history parameter. This controls the maximum size of the memory database in use by Netdata.
Here, you will have to decide how much Memory you want to allocate to Netdata, or how much time you want to keep the recorded chart data before it is lost:
3600 seconds (1 hour of chart data retention) uses 15 MB of RAM
7200 seconds (2 hours of chart data retention) uses 30 MB of RAM
14400 seconds (4 hours of chart data retention) uses 60 MB of RAM
28800 seconds (8 hours of chart data retention) uses 120 MB of RAM
43200 seconds (12 hours of chart data retention) uses 180 MB of RAM
86400 seconds (24 hours of chart data retention) uses 360 MB of RAM
Keep in mind that the above estimations are based upon the number of charts in use by the stock dashboard. Removing or adding custom charts in the future will influence these estimates.
Edit Netdata's main configuration file with nano or whatever your favorite text editor.
sudo nano /etc/netdata/netdata.conf
Locate the history option in the [global] section.
/etc/netdata/netdata.conf
. . .
[global]
# glibc malloc arena max for plugins = 1
. . .
# hostname = test-netdata
# history = 3600
# update every = 1
. . .
Replace the 3600 value to the one you have already decided. We're using 14400, which gives us 4 hours of data retention. Make sure to also uncomment the line by deleting the # symbol so this option is no longer ignored by Netdata.
/etc/netdata/netdata.conf
. . .
[global]
# glibc malloc arena max for plugins = 1
. . .
# hostname = test-netdata
history = 14400
# update every = 1
. . .
Save and close the file after making this change.
While this modification likely increased the amount of RAM that Netdata will use, the next modification we'll implement in the upcoming step should reduce it significantly.
Enabling Kernel Same-page Merging
To permanently enable this in the Linux system kernel, edit the /etc/rc.local file with a text editor.
sudo nano /etc/rc.local
This /etc/rc.local file or run control file is executed after all other normal Linux system services and processes are started. It is useful for specifying custom services — or, in our case, for enabling KSM at server run time.
Add the two commands highlighted below to the end of the file, before the last exit 0 line, as shown below:
/etc/rc.local
#!/bin/sh -e
#
# rc.local
#
# This script is executed at the end of each multiuser runlevel.
# Make sure that the script will "exit 0" on success or any other
# value on error.
#
# In order to enable or disable this script just change the execution
# bits.
#
# By default this script does nothing.
echo 1 > /sys/kernel/mm/ksm/run
echo 1000 > /sys/kernel/mm/ksm/sleep_millisecs
exit 0
The first command adds a 1 into the run KSM kernel file, which enables the feature. The second command tells the the KSM daemon to run once per second and evaluate 100 pages for de-duplication.
Once you save and close the file, KSM will now be enabled the next time the server reboots, and persist through future reboots. To enable it for the rest of this server's current uptime, you need to run the two commands you added to rc.local manually on the command line.
First, initiate and enter a new shell session as the server's root user by using the -s flag with sudo. This is necessary because the two commands from earlier use output redirection (via the > operator) and need to be executed by a root shell to succeed.
sudo -s
Now enter the two commands from before:
echo 1 > /sys/kernel/mm/ksm/run
echo 1000 > /sys/kernel/mm/ksm/sleep_millisecs
Then, leave the root shell and return your normal shell session.
exit
Finally, to apply all the changes we have made in this step and the step before this, we must restart Netdata.
sudo systemctl restart netdata
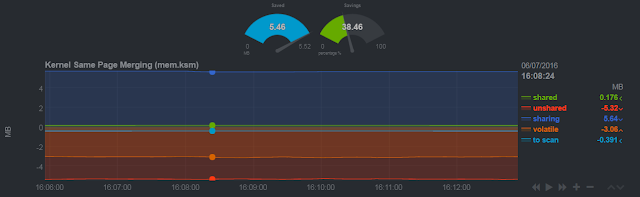
Here, you can verify that KSM is now enabled by looking for the newly added active KSM chart in the Netdata dashboard. This is found in the menu tree on the right, under Memory > Memory Deduper.
Now you know that the dashboard and KSM are working, it's worth granting access to the dashboard through a web server like Nginx instead of the built-in web server. This isn't completely necessary, but it is recommended, so follow the next step to set it up.
Hosting the Dashboard through Nginx
Hosting Netdata using Nginx makes it easier to secure access to the dashboard and also lets you point to other servers' Netdata dashboards in the future, should you need to.
You need to install the apache2-utils package. This package contains the htpasswd program, which we're going to need later on for securing access to the dashboard page.
sudo apt-get install apache2-utils
Now, create a new Nginx host configuration file. Note that here, we're using a file in the /conf.d directory, but you could use /sites-available and /sites-enabled if you're using Nginx for things other than Netdata.
sudo nano /etc/nginx/conf.d/default.conf
This configuration file will tell Nginx to proxy incoming requests for the dashboard page. We'll also add a simple authentication prompt so only those with the correct username and password can access it.
Following is the entire configuration file for you to copy and paste. Change the two items for the listen and server_name directives to your server's IP address and allocated domain name, respectively. Don't forget to include the terminating ; at the end of each. If you don't have a domain name, you can leave the server_name directive as example.com.
/etc/nginx/conf.d/default.conf
upstream netdata-backend {
server 127.0.0.1:19999;
keepalive 64;
}
server {
listen your_server_ip:80;
server_name example.com;
auth_basic "Authentication Required";
auth_basic_user_file netdata-access;
location / {
proxy_set_header X-Forwarded-Host $host;
proxy_set_header X-Forwarded-Server $host;
proxy_set_header X-Forwarded-For $proxy_add_x_forwarded_for;
proxy_pass http://netdata-backend;
proxy_http_version 1.1;
proxy_pass_request_headers on;
proxy_set_header Connection "keep-alive";
proxy_store off;
}
}
Now save and exit to return to the command prompt.
Let me explain this file so you may understand how it's working. This is the first section:
/etc/nginx/conf.d/default.conf
upstream netdata-backend {
server 127.0.0.1:19999;
keepalive 64;
}
This upstream module named as netdata-backend targets the built-in Netdata web server by using the server's loopback address, 127.0.0.1, and Netdata's port, 19999. A keepalive directive sets the maximum number of upstream idle connections that can remain open at any given time (for each Nginx worker process). This upstream module definition is required later on by the proxy_pass directive.
Directly after this is the main server block.
/etc/nginx/conf.d/default.conf
server {
listen your_server_ip:80;
server_name example.com;
auth_basic "Authentication Required";
auth_basic_user_file netdata-access;
The first two line in the block defines the external IP address Nginx should listen for when clients attempt to connect. The server_name directive tells Nginx to run this server block when a client uses the specified domain name.
The last two lines in this snippet set up the simple HTTP username and password authentication. It does this using the auth_basic module to display a username and password prompt. You can customize the message for the prompt; here, it's set to Authentication Required. auth_basic_user_file designates a file name and location to store the login credentials of the authentication prompt, created later on in this step.
The last location block, nested inside the server block, handles the proxying and passing on of incoming requests to Nginx.
/etc/nginx/conf.d/default.conf
location / {
proxy_set_header X-Forwarded-Host $host;
proxy_set_header X-Forwarded-Server $host;
proxy_set_header X-Forwarded-For $proxy_add_x_forwarded_for;
proxy_pass http://netdata-backend;
proxy_http_version 1.1;
proxy_pass_request_headers on;
proxy_set_header Connection "keep-alive";
proxy_store off;
}
}
Basically, this code is what passes client requests to the Netdata web server, and in turn the dashboard. The proxy_pass directive line refers back to the upstream module at the start of the file must point to it by name, netdata-backend.
If you haven't already, you can save and close this configuration file. Here is where the htpasswd program from the apache2-utils package helps us create the user login credentials for the dashboard login prompt.
First, we'll create a username and password. Run the following command, replacing sammy with whichever username you'd like to use in Netdata. When prompted, enter the password you'd like to use.
sudo htpasswd -c /etc/nginx/netdata-access sammy
This creates a file at /etc/nginx/netdata-access that contains the username and password you provided. The generated password is encrypted within the file, so it cannot be seen as plain text.
Restart Nginx to make the new configuration we added active.
sudo systemctl restart nginx
To test the Nginx configuration for the first time, visit http://ubuntu_server_ip in your favorite web browser. You'll see an authentication prompt. Enter in the username plus password you provided earlier on in this step to get access to the dashboard, which we'll explore in Step 5.
Exploring the Netdata's Dashboard
If you didn't follow the Ngnix installation (Optional) step we have mentioned above, visit http://ubuntu_server_ip:19999/ in your favorite browser now to access the dashboard.
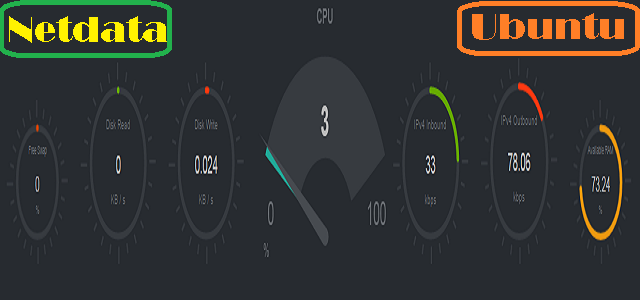
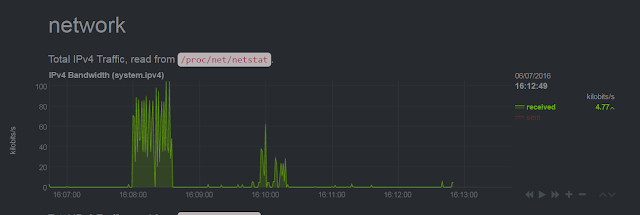
You can see the dashboard and an overview of the system's live metrics. The HUD style indicators at the top of the page change when you mouse-over each time period in the subsequent graphs.
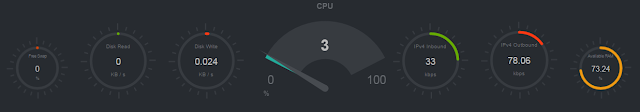
The individual graphs and charts in this overview section give detailed accounts of each system aspect, ranging from CPU to memory to networking traffic and more.

Charts are interactive and can be dragged left or right with your mouse to pan back and forth through the different time intervals.
Holding down Shift and scrolling in or out with your mouse wheel on a graph will narrow or widen the time markers. Double click on a chart to reset it back to it's default appearance and view.
The quickest way of navigating around the dashboard is by using the menu tree on the right of the page. This changes focus and color depending on which section of the page you are currently viewing.
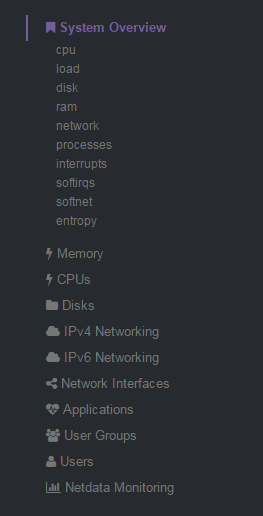
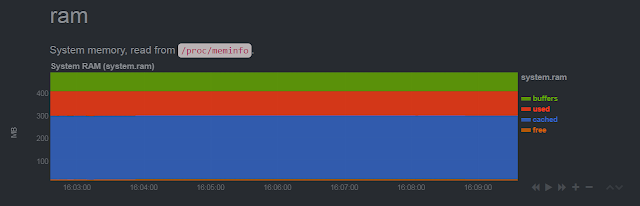
Scrolling down the page or using the menu tree gives access to even more in-depth charts. These are very detailed and are controlled in the same manner as the graphs in the initial overview section.

There are many of these extra stat-specific charts available through Netdata.
One important part of the GUI is the update page. Netdata receives updates quite regularly and keeping your installation current is easy to do. The dashboard contains an Update button at the top that allows you to check whether a new version is available for download.
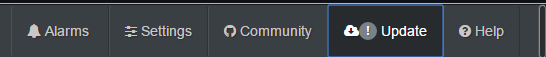
Clicking this button opens a new menu with more details, and a Check Now button to manually check for updates.
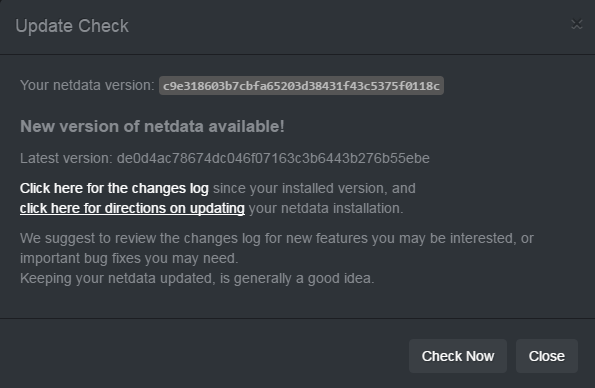
If there's an update available, you just need to run the supplied update script from the Netdata Git repository, which we cloned to the Linux user's home directory in the first step. That is, when an update is available, just run sudo ~/netdata/netdata-updater.sh from the command line.


