Condusiv offers a free tool that allows you to examine overall I/O performance and ranks systems in red, yellow, green to quickly identify which systems suffer from I/O issues and how badly – and which
don’t.
The key performance metric for traditional hard disk drive (HDD) and newer solid-state drive (SSD) storage is the input/output (I/O) operations per second, also called IOPS. The higher the IOPS value, the more data the disk can read or write. This benefit speeds up your system—all of these are obvious, elementary points.
What isn't obvious is how to generate meaningful, quantitative statistics to back up your hunch that your server's storage subsystem feels slow. You are much more likely to have your purchase request for a new hard drive approved if you can use hard data and graphs to demonstrate to your boss how and why a system performs slowly and how it can benefit from a new, faster storage system, or other performance enhancing solutions like I/O reduction software.
Condusiv makes an I/O Assessment Tool, which is currently free for use. Go ahead and download the software.
You can install the Condusiv I/O Assessment Tool on any of the following Windows versions:
Windows 7
Windows 8.1
Windows 10
Windows Server 2008 R2
Windows Server 2012 R2
Windows Server 2016
You'll need to install the .NET Framework 4.5.1 on all Windows versions prior to 10 or 2016.
Starting an assessment
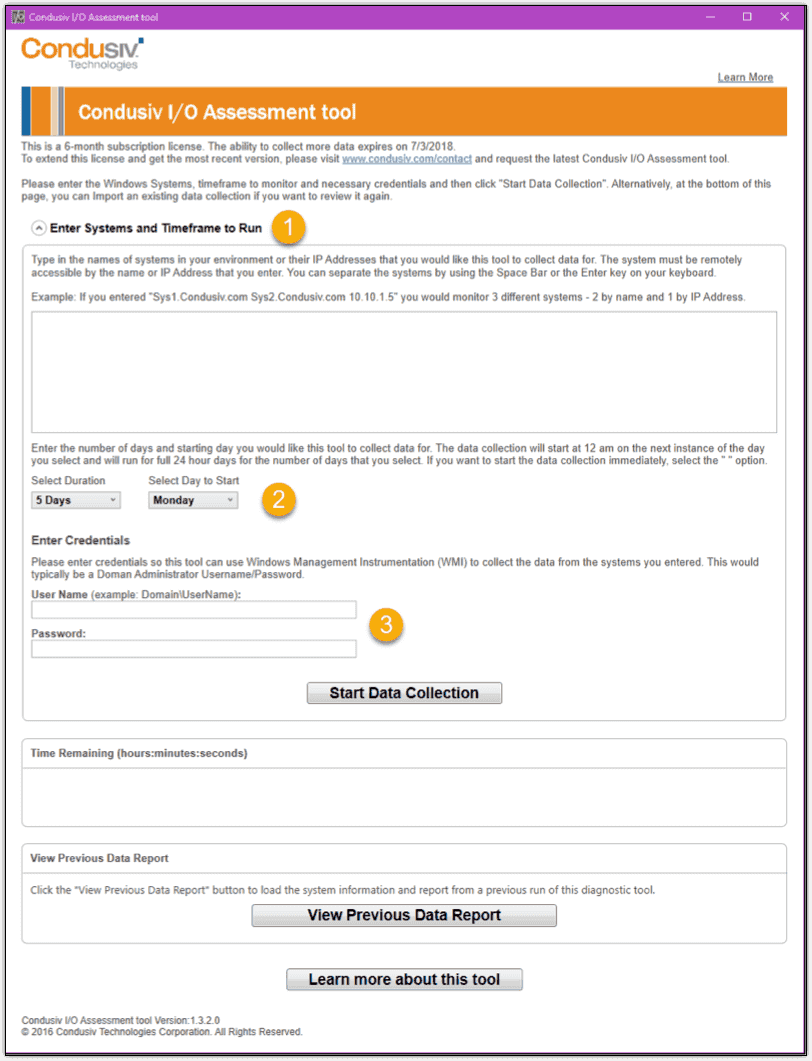
Open up the tool, and it'll prompt you for three pieces of information, shown in the first screenshot.
![]()
Target systems: Specify a comma-separated list of DNS names and/or IPv4 addresses on all systems you want to evaluate. As you might expect, the remote data collection takes place via Windows Management Instrumentation (WMI). Note that you do not have to install IOAT on every monitored system.
Test duration: You can test between one and seven days, starting now or at 12:01 a.m. on a specified day of the week. The idea here is you want to capture all the peaks and valleys of your systems' ordinary usage patterns. Condusiv recommends collecting data for five consecutive production days.
Credentials: You should specify a member of the Domain Admins global group to ensure WMI can capture disk I/O activity on all monitored hosts.
You may have noticed in the IOAT application fine print that Condusiv gives you a six-month license. You can request an extension, however.
When you're ready, click Start Data Collection and minimize the application. You'll need to keep the application running over the duration of the testing period. Closing it will automatically cancel the data capture. Here's a screenshot showing IOAT in active evaluation mode.
![]()
Analyzing the results
After the test time has elapsed, IOAT produces a report in a separate window showing the source and extent of I/O issues across 11 metrics, as shown next. I'll explain each part of this report as well.
![]()
A: Systems Included in Report: This summary shows the overall storage system state at a glance.
B: I/O Assessment Metrics: Expand this section to see sub-reports that show an hour-by-hour topology for each key metric.
C: Conclusion: This graph tells you the I/O issues that deviate beyond the median range and your potential for performance optimization.
D: Submit Results: Optionally, you can transfer your report data to Condusiv to get the opinion of their support engineers.
The tool offers the option to submit your results to Condusiv and an engineer can step through the results with you. Condusiv does not charge for this service, but if you are experiencing I/O inefficiencies, you might want to discuss evaluating their I/O reduction software as it could be more cost-effective than purchasing hardware upgrades.
The ability to submit your results to Condusiv is actually a really nice service. I don't know about you, but I'm able to interpret I/O performance results only to a certain point. Actually, let's look at a couple of my results charts to see if any useful information jumps out.
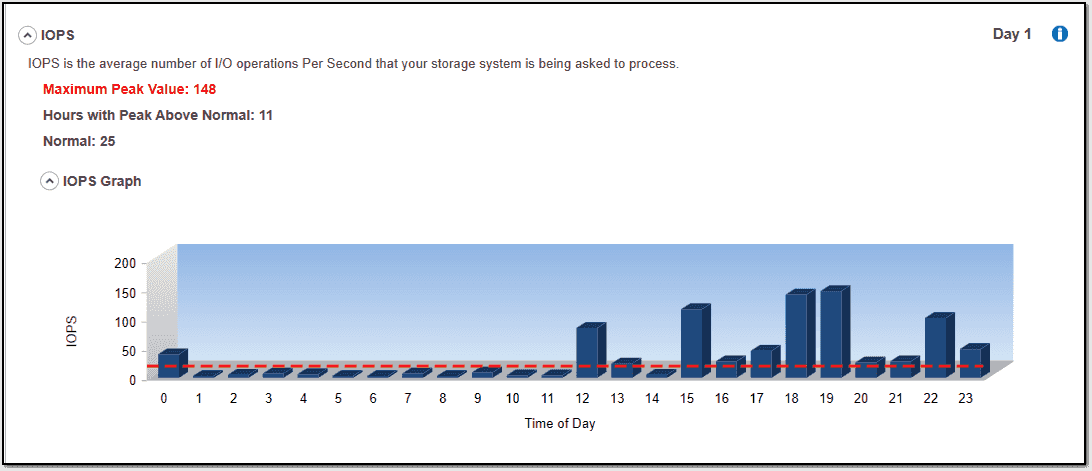
I performed a 24-hour analysis on my Lenovo laptop running Windows 10. Admittedly, the system was pretty quiet during a good portion of that day. To start, let's look at the IOPS chart.
![]()
IOAT gives us a brief description of the IOPS metric and then displays the maximum peak value, the hours with a peak above normal, and what Condusiv considers a normal value. On my system, my laptop's hard drive was doing a great deal of read/write operations for roughly half the testing period.
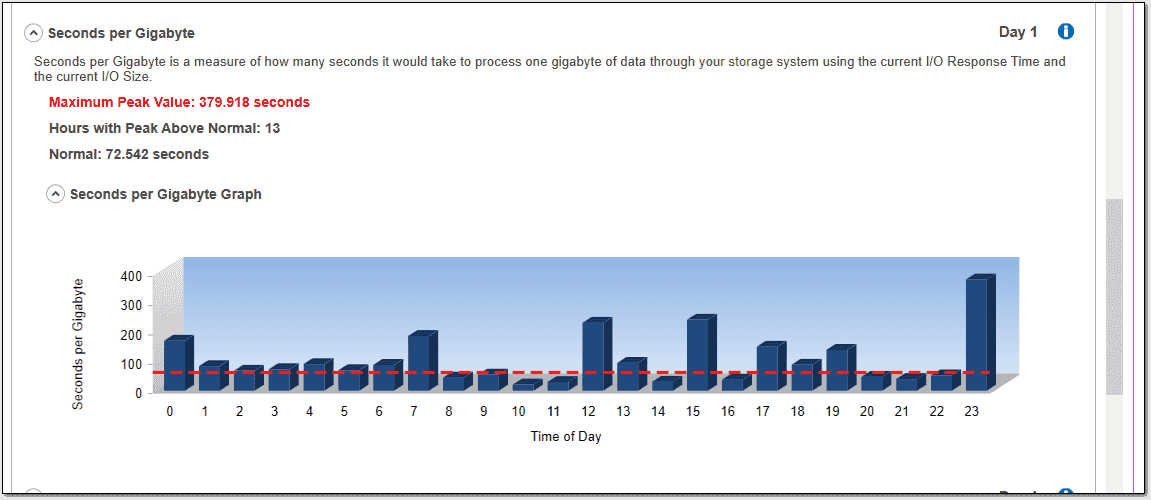
Next, let's look at the Seconds per Gigabyte chart.
![]()
Overall, IOAT shown me I had high potential for I/O optimization, and it detected moderate I/O performance issues. The good news here is that the IOAT confirmed with quantitative data what I suspected qualitatively. The bad news is that IOAT doesn't provide any specific guidance for improving storage subsystem speed.
I'm guessing maybe this is what you get if you submit your results to Condusiv, and one of their engineers gets back to you. I don't know. At the very least, however, this is quite a bit of nice value for a net cost of $0.00.
Conclusion
If you need to gather storage statistics for one or more of your servers, I would say the Condusiv I/O Assessment Tool gives you a far more robust experience than using, say, Windows Performance Monitor – which only displays Windows performance data but doesn’t provide any analysis nor information as to whether results should be of concern. I almost forgot to tell you that IOAT allows you to print your report charts in PDF format and save the numerical data in CSV format.
Moreover, you can click View Previous Data Report in the main interface to load up a previously generated CSV to see the "pretty pictures" again. No doubt, Condusiv is a friend to the Windows systems administrator, and I appreciate having free troubleshooting tool like this at no charge.
don’t.
The key performance metric for traditional hard disk drive (HDD) and newer solid-state drive (SSD) storage is the input/output (I/O) operations per second, also called IOPS. The higher the IOPS value, the more data the disk can read or write. This benefit speeds up your system—all of these are obvious, elementary points.
What isn't obvious is how to generate meaningful, quantitative statistics to back up your hunch that your server's storage subsystem feels slow. You are much more likely to have your purchase request for a new hard drive approved if you can use hard data and graphs to demonstrate to your boss how and why a system performs slowly and how it can benefit from a new, faster storage system, or other performance enhancing solutions like I/O reduction software.
Condusiv makes an I/O Assessment Tool, which is currently free for use. Go ahead and download the software.
You can install the Condusiv I/O Assessment Tool on any of the following Windows versions:
Windows 7
Windows 8.1
Windows 10
Windows Server 2008 R2
Windows Server 2012 R2
Windows Server 2016
You'll need to install the .NET Framework 4.5.1 on all Windows versions prior to 10 or 2016.
Starting an assessment
Open up the tool, and it'll prompt you for three pieces of information, shown in the first screenshot.
Target systems: Specify a comma-separated list of DNS names and/or IPv4 addresses on all systems you want to evaluate. As you might expect, the remote data collection takes place via Windows Management Instrumentation (WMI). Note that you do not have to install IOAT on every monitored system.
Test duration: You can test between one and seven days, starting now or at 12:01 a.m. on a specified day of the week. The idea here is you want to capture all the peaks and valleys of your systems' ordinary usage patterns. Condusiv recommends collecting data for five consecutive production days.
Credentials: You should specify a member of the Domain Admins global group to ensure WMI can capture disk I/O activity on all monitored hosts.
You may have noticed in the IOAT application fine print that Condusiv gives you a six-month license. You can request an extension, however.
When you're ready, click Start Data Collection and minimize the application. You'll need to keep the application running over the duration of the testing period. Closing it will automatically cancel the data capture. Here's a screenshot showing IOAT in active evaluation mode.

Analyzing the results
After the test time has elapsed, IOAT produces a report in a separate window showing the source and extent of I/O issues across 11 metrics, as shown next. I'll explain each part of this report as well.

A: Systems Included in Report: This summary shows the overall storage system state at a glance.
B: I/O Assessment Metrics: Expand this section to see sub-reports that show an hour-by-hour topology for each key metric.
C: Conclusion: This graph tells you the I/O issues that deviate beyond the median range and your potential for performance optimization.
D: Submit Results: Optionally, you can transfer your report data to Condusiv to get the opinion of their support engineers.
The tool offers the option to submit your results to Condusiv and an engineer can step through the results with you. Condusiv does not charge for this service, but if you are experiencing I/O inefficiencies, you might want to discuss evaluating their I/O reduction software as it could be more cost-effective than purchasing hardware upgrades.
The ability to submit your results to Condusiv is actually a really nice service. I don't know about you, but I'm able to interpret I/O performance results only to a certain point. Actually, let's look at a couple of my results charts to see if any useful information jumps out.
I performed a 24-hour analysis on my Lenovo laptop running Windows 10. Admittedly, the system was pretty quiet during a good portion of that day. To start, let's look at the IOPS chart.
IOAT gives us a brief description of the IOPS metric and then displays the maximum peak value, the hours with a peak above normal, and what Condusiv considers a normal value. On my system, my laptop's hard drive was doing a great deal of read/write operations for roughly half the testing period.
Next, let's look at the Seconds per Gigabyte chart.
Overall, IOAT shown me I had high potential for I/O optimization, and it detected moderate I/O performance issues. The good news here is that the IOAT confirmed with quantitative data what I suspected qualitatively. The bad news is that IOAT doesn't provide any specific guidance for improving storage subsystem speed.
I'm guessing maybe this is what you get if you submit your results to Condusiv, and one of their engineers gets back to you. I don't know. At the very least, however, this is quite a bit of nice value for a net cost of $0.00.
Conclusion
If you need to gather storage statistics for one or more of your servers, I would say the Condusiv I/O Assessment Tool gives you a far more robust experience than using, say, Windows Performance Monitor – which only displays Windows performance data but doesn’t provide any analysis nor information as to whether results should be of concern. I almost forgot to tell you that IOAT allows you to print your report charts in PDF format and save the numerical data in CSV format.
Moreover, you can click View Previous Data Report in the main interface to load up a previously generated CSV to see the "pretty pictures" again. No doubt, Condusiv is a friend to the Windows systems administrator, and I appreciate having free troubleshooting tool like this at no charge.


